FIGURE

Fig 6

ID
ZDB-FIG-231215-205
Publication
Maung Ye et al., 2023 - A cell-and-plasma numerical model reveals hemodynamic stress and flow adaptation in zebrafish microvessels after morphological alteration
Other Figures
All Figure Page
Back to All Figure Page
Fig 6

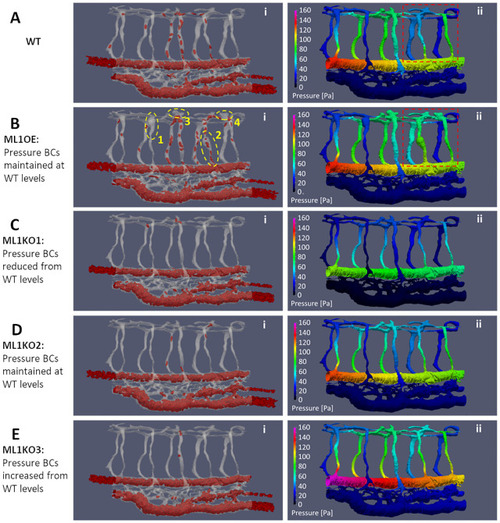
Hemodynamics adaptation scenarios for Marcksl1 OE and Marcksl1 KO.

(A) WT levels of RBC (i) and systolic blood pressure (ii) distribution, see S1 Movie. (B) Marcksl1 OE model (ML1OE) with same blood pressure boundary conditions (BCs) at anterior/posterior input locations as WT. Spatial maps of RBC perfusion (Bi) and systolic blood pressure distribution (Bii) where yellow dashed circles indicate the locally dilated lumen region compared to WT (Bi), see S7 Movie. Dashed red box region in Aii and Bii is the local network region where pressure distribution has been altered between WT and ML1OE. (C—E) Marcksl1 KO Model 1 (ML1KO1, C) with reduced blood pressure BCs, Marcksl1 KO Model 2 (ML1KO2, D) with same blood pressure BCs as WT and Marcksl1 KO Model 3 (ML1KO3, E) with increased blood pressure BCs. Spatial maps of RBC perfusion (i) and systolic blood pressure distribution (ii), see S8S10 Movies.

Expression Data

Expression Detail
Antibody Labeling
Phenotype Data

Phenotype Detail
Acknowledgments
This image is the copyrighted work of the attributed author or publisher, and ZFIN has permission only to display this image to its users. Additional permissions should be obtained from the applicable author or publisher of the image. Full text @ PLoS Comput. Biol.