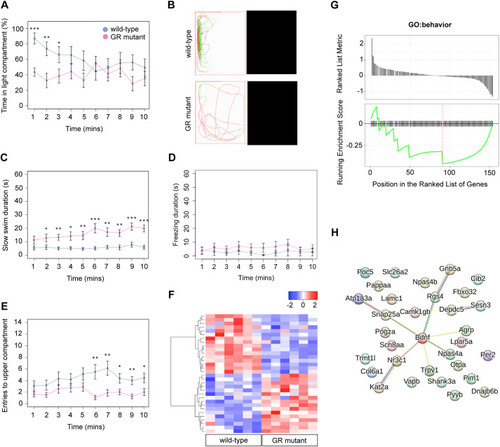
The glucocorticoid receptor regulates behaviour and expression of behaviour-associated genes in the adult zebrafish. (A,B) Behavioural analysis of adult fish in the scototaxis test. Plotted in A is the time fish spent in the light part of the tank. Wild-type adults display a significant initial preference for the light part of the tank, whereas GR mutants show no preference for either the light or the dark areas [repeated measures ANOVA, main effect of genotype: F=4.8, degrees of freedom (d.f.)=1, 15 (P=0.044); main effect of time: F=5.53, d.f.=1, 15 (P=0.033); genotype: time interaction: F=4.60, d.f.=1, 15 (P=0.048)]. n=8 wild-type fish, n=9 GR-mutant fish, one experiment). Asterisks indicate statistical differences in Tukey post-hoc analysis. *P<0.05, **P<0.01, ***P<0.001. (B) Representative traces of wild-type and GR-mutant fish swimming during the first minute of the scototaxis test. Black rectangular areas (right) indicate the dark part of the tank where swim trajectory could not be traced; white rectangular areas (left) indicate the light part of the tank, with fish trajectories indicated in red (fast swimming >9cm/s) and green (medium swimming 2–9 cm/s). (C–E) Behavioural analysis of adult fish during the novel tank diving test. Plotted is the duration of slow swimming (<2 cm/s) (C), and the duration of freezing (D) and exploratory behaviour (E) of adult wild-type (blue) and GR-mutant (red) fish after diving into a novel tank (n=16 fish per group, across two independent experiments). (C) Adult GR-mutant fish swam slower in the novel tank than wild-type adults [ANOVA with repeated measures: significant effect of genotype: F=17.4, d.f.=1, 30 (P=0.0002); main effect of time: F=25.3, d.f.=1, 286 (P≤0.0001); significant genotype: time interaction: F=14.3, d.f.=1, 286 (P=0.0002)]. *P<0.05, **P<0.01, ***P<0.001. (D) Compared with wild-type fish, GR-mutant fish show no differences in the duration of freezing behaviour in the novel tank diving test [ANOVA with repeated measures: main effect of genotype: F=1.087, d.f.=1, 30 (P=0.305); main effect of time: F=0.05, d.f.=1, 286 (P=0.83); genotype: time interaction: F=0.35, d.f.=1, 286 (P=0.56)]. (E) Adult GR-mutant fish were less exploratory than wild-type adults in the novel tank, exhibiting fewer entries to the upper compartment of the novel tank than wild-type fish [ANOVA with repeated measures: main effect of genotype: F=7.38, d.f.=1, 30 (P=0.011); main effect of time: F=1.9, d.f.=1, 286 (P=0.169); genotype: time interaction: F=4.84, d.f.=1, 286 (P=0.0286)]. Asterisks indicate significant difference in Tukey post-hoc analysis. *P<0.05, **P<0.01, ***P<0.001. All behaviour plots show mean±s.e.m. (F) Heatmap showing relative expression (normalised counts) of 32 genes associated with GO term ‘behavior’, which are differentially expressed in the wild-type and GR-mutant adult brain transcriptomes. These DEGs included equal numbers of upregulated and downregulated genes. (G) Gene set enrichment analysis (GSEA) plots of all genes associated with the GO term ‘behavior’ detected in the RNA-Seq data set. (Top panel) Distribution of the fold-change through the list of genes. (Bottom panel) Plotted is the running sum (green line) of the enrichment scores, with the red dashed line indicating the maximum enrichment score for the gene set. The row of black vertical lines indicates the positions of individual genes. The enrichment score for GO term ‘behavior’ was −0.458 (P=0.035), suggesting significant enrichment of behaviour-associated DEGs within this dataset. (H) STRING protein–protein interaction network of proteins encoded by GR-regulated genes in the GO category Biological process under the term ‘behavior’ indicates roles for Bdnf and for functional interactors, such as Agrp, Npas4a, Trpv1, Snap25a and Rgs4 downstream of GR function. Individual proteins are shown as nodes, edges are links between proteins signifying the various interaction data that support the interactions, all colouring is according to evidence type (see von Mering et al., 2007) and STRING website for colour legend.
|