FIGURE SUMMARY
Title

Glucocorticoid Receptor regulates protein chaperone, circadian clock and affective disorder genes in the zebrafish brain

Authors
Eachus, H., Oberski, L., Paveley, J., Bacila, I., Ashton, J.P., Esposito, U., Seifuddin, F., Pirooznia, M., Elhaik, E., Placzek, M., Krone, N., Cunliffe, V.T.
Source
Full text @ Dis. Model. Mech.

Whole-genome bisulphite sequencing (WGBS) analysis of wild-type and GR-mutant adult brain samples. (A) Graphs (top) indicating average DNA methylation (in %) across gene bodies and flanking sequences extending −5 kb upstream of the transcription start site (TSS) and +5 kb downstream of transcription termination site (TTS), in wild-type and GR-mutant adult brain samples analysed by WGBS. Heatmap (bottom) showing the distribution of methylated cytosine and guanine dinucleotides separated by a phosphate (CpGs) within gene bodies and flanking DNA sequences in wild-type and GR-mutant adult brain samples analysed by WGBS, covering the region from −5 kb upstream of the TSS to 5 kb downstream of the TTS, for the 1448 genes for which there was >95% coverage of CpGs within the plotted region. Deeper blue corresponds to a higher level of methylation. In wild-type (n=2) and GR-mutant (n=2) samples, gene bodies are typically highly methylated and promoters exhibit reduced or absent methylation, confirming that the global genomic DNA methylation patterns in the zebrafish brain samples analysed are similar to those previously described. (B) Histogram showing frequency distribution of DMRs identified by WGBS according to the number of CpGs within each DMR. Detailed summaries of all DMRs are provided in Table S1. (C) Plot of the number of CpGs within DMRs against the AreaStat measure of differential methylation (mean±s.e.m.). Negative values indicate DMRs that are hypomethylated and positive values indicate DMRs that are hypermethylated in GR-mutant adult male brain compared to that in wild-type fish. (D) Pie chart indicating the location of DMRs in relation to types of gene. The majority (181 of 249) DMRs are associated with protein-coding genes, some are intergenic, and a small number are associated with long non-coding RNAs (lncRNAs) or processed transcripts. (E) Histogram displaying the number of hypermethylated and hypomethylated DMRs associated with different locations in relation to genes. 47 DMRs are located within a putative gene promoter and 59 are located within the first intron. 22 DMRs are within an exon or a region that potentially pertains to an intron of one gene and an exon of another gene (labelled as exon/intron, whilst 62 DMRs are associated with an intron other than intron 1). (F) The top four slimmed (identified) Gene Ontology (GO) terms associated with biological processes enriched in GR-mutant versus wild-type methylome data. Identification was with the Princeton GO term finder, with a cut-off of P<0.05.

Targeted analysis of DNA methylation within high-ranking DMRs by using the BisPCR2 technique. (A–D) The percentage of methylation of individual CpGs within a subset of high-ranking DMRs identified in the WGBS analysis was determined using the BisPCR2 technique in wild-type (n=10) and GR-mutant (n=10) adult male zebrafish brains. DMRs associated with the following genes were confirmed by BisPCR2: fkbp5 (A), foxred2 (B), lpar6a (intron 2)/ece2b (intron 8) (C), npepl1 (D); indicated on the x-axes is the number of the first nucleotide of each CpG on the respective chromosome of the Danio rerio reference genome (GRCz10 release 85). Histograms show mean percentage of methylation±s.e.m. in wild-type and GR-mutant adult brains. On average, a coverage of 4093 reads per amplicon was obtained across all samples subjected to BisPCR2 analysis. Significant differences between wild-type and GR-mutant brains regarding the level of CpG methylation were determined using the Mann–Whitney test (#P<0.06, *P<0.05,***P<0.001).

Differential gene expression in wild-type and GR-mutant brain transcriptomes of adult zebrafish. (A) Heatmap with hierarchical clustering of genes (rows) showing relative expression of all significant differentially expressed genes (DEGs) (P<0.05) in individual wild-type (n=6, cyan) and individual GR-mutant (n=6, orange) brains. Red indicates upregulation, blue indicates downregulation. (B) MA plot with overlaid density contour lines showing individual mean normalised counts for each transcript across all samples plotted against log2 fold-change (LFC) in average counts for each transcript between wild-type and GR-mutant adult brain samples. As the average mean of normalised counts increases, the requirements of a gene to be differentially expressed are more likely to be met. Grey points correspond to genes that were independently filtered from the analysis (high dispersion, low mean of normalised counts) and lack an adjusted P-value (Padj). The Padj threshold for statistically significant differential expression was set at P<0.05 and genes exhibiting significant differential expression are indicated by coloured points. A total of 4483 genes exhibit significant differential expression. Of those, 2001 genes are upregulated and 2482 are downregulated in GR-mutant brains compared to those of wild-type fish. (C) Heatmap with hierarchical clustering of genes (rows) showing relative expression of the top 25 most significant DEGs in individual wild-type (cyan) and GR-mutant (orange) brains. Of these genes, four are upregulated and 21 are downregulated in GR-mutant brains. (D) Volcano plot showing DEGs in transcriptomes of wild-type and GR-mutant adult brain. The statistically significant −log10 Padj values are plotted on the x-axis against LFC in counts for each transcript (magnitude of differential expression) on the y-axis. Dashed lines correspond to Padj and LFC cut-off values set at P<0.05 and 0.58, respectively. Pink dots indicate DEGs (Padj<0.05); blue dots indicate DEGs (Padj<0.05) above or below the set LFC threshold of +0.58 or −0.58, respectively. Genes with the 20 smallest Padj values, i.e. those with a statistically most-significant differential expression, are named.

Gene Ontology and protein–protein interaction network analysis of genes exhibiting differential expression in wild-type and GR-mutant brains. (A) REVIGO TreeMap produced with a REVIGO-generated R script by using the Biological process terms identified with the Gene Ontology (GO) enrichment analysis and visualisation (GOrilla) tool (threshold P-value set to <10−5), which are linked to transcripts exhibiting differential expression in wild-type and GR-mutant adult brain transcriptomes (n=6 fish, for each genotype). (B) Dot Plot using the enrichGO function within the clusterProfiler R package to identify Biological process GO terms linked to transcripts exhibiting differential expression in wild-type and GR-mutant adult brain transcriptomes (q-value cut-off was 0.05). The circle diameter indicates the number of genes linked to a specific GO term (count number). The gene ratio is the percentage of the total number of differentially expressed genes linked to a specific GO term. (C) UpSet Plot using the enrichGO function within the clusterProfiler R package to identify intersections between Biological process GO term-linked gene sets that exhibit differential expression in wild-type and GR-mutant adult brain transcriptomes. Indicated on the y-axis are the number of genes found in the GO categories. (D–F) STRING protein–protein interaction networks of proteins encoded by GR-regulated genes under the GO terms ‘chaperone-mediated protein folding’ (D), ‘circadian rhythm’ (E) or ‘regulation of primary metabolic process’ (F), respectively indicating interactions between many protein chaperones, circadian clock transcription factors or circadian clock transcription factors and immediate-early transcription factors. Individual proteins are nodes, edges are links between proteins signifying the various interaction data that support the interactions, all colouring is according to evidence type (see von Mering et al., 2007) and STRING website for colour legend.

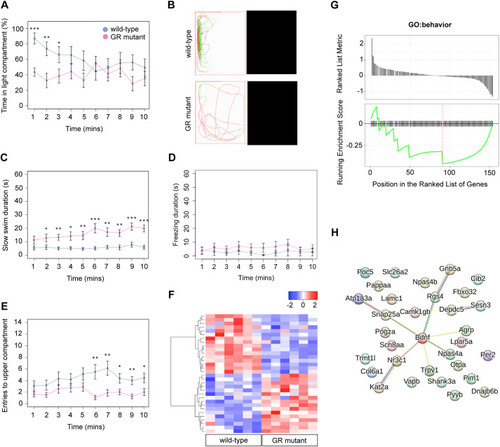
The glucocorticoid receptor regulates behaviour and expression of behaviour-associated genes in the adult zebrafish. (A,B) Behavioural analysis of adult fish in the scototaxis test. Plotted in A is the time fish spent in the light part of the tank. Wild-type adults display a significant initial preference for the light part of the tank, whereas GR mutants show no preference for either the light or the dark areas [repeated measures ANOVA, main effect of genotype: F=4.8, degrees of freedom (d.f.)=1, 15 (P=0.044); main effect of time: F=5.53, d.f.=1, 15 (P=0.033); genotype: time interaction: F=4.60, d.f.=1, 15 (P=0.048)]. n=8 wild-type fish, n=9 GR-mutant fish, one experiment). Asterisks indicate statistical differences in Tukey post-hoc analysis. *P<0.05, **P<0.01, ***P<0.001. (B) Representative traces of wild-type and GR-mutant fish swimming during the first minute of the scototaxis test. Black rectangular areas (right) indicate the dark part of the tank where swim trajectory could not be traced; white rectangular areas (left) indicate the light part of the tank, with fish trajectories indicated in red (fast swimming >9cm/s) and green (medium swimming 2–9 cm/s). (C–E) Behavioural analysis of adult fish during the novel tank diving test. Plotted is the duration of slow swimming (<2 cm/s) (C), and the duration of freezing (D) and exploratory behaviour (E) of adult wild-type (blue) and GR-mutant (red) fish after diving into a novel tank (n=16 fish per group, across two independent experiments). (C) Adult GR-mutant fish swam slower in the novel tank than wild-type adults [ANOVA with repeated measures: significant effect of genotype: F=17.4, d.f.=1, 30 (P=0.0002); main effect of time: F=25.3, d.f.=1, 286 (P≤0.0001); significant genotype: time interaction: F=14.3, d.f.=1, 286 (P=0.0002)]. *P<0.05, **P<0.01, ***P<0.001. (D) Compared with wild-type fish, GR-mutant fish show no differences in the duration of freezing behaviour in the novel tank diving test [ANOVA with repeated measures: main effect of genotype: F=1.087, d.f.=1, 30 (P=0.305); main effect of time: F=0.05, d.f.=1, 286 (P=0.83); genotype: time interaction: F=0.35, d.f.=1, 286 (P=0.56)]. (E) Adult GR-mutant fish were less exploratory than wild-type adults in the novel tank, exhibiting fewer entries to the upper compartment of the novel tank than wild-type fish [ANOVA with repeated measures: main effect of genotype: F=7.38, d.f.=1, 30 (P=0.011); main effect of time: F=1.9, d.f.=1, 286 (P=0.169); genotype: time interaction: F=4.84, d.f.=1, 286 (P=0.0286)]. Asterisks indicate significant difference in Tukey post-hoc analysis. *P<0.05, **P<0.01, ***P<0.001. All behaviour plots show mean±s.e.m. (F) Heatmap showing relative expression (normalised counts) of 32 genes associated with GO term ‘behavior’, which are differentially expressed in the wild-type and GR-mutant adult brain transcriptomes. These DEGs included equal numbers of upregulated and downregulated genes. (G) Gene set enrichment analysis (GSEA) plots of all genes associated with the GO term ‘behavior’ detected in the RNA-Seq data set. (Top panel) Distribution of the fold-change through the list of genes. (Bottom panel) Plotted is the running sum (green line) of the enrichment scores, with the red dashed line indicating the maximum enrichment score for the gene set. The row of black vertical lines indicates the positions of individual genes. The enrichment score for GO term ‘behavior’ was −0.458 (P=0.035), suggesting significant enrichment of behaviour-associated DEGs within this dataset. (H) STRING protein–protein interaction network of proteins encoded by GR-regulated genes in the GO category Biological process under the term ‘behavior’ indicates roles for Bdnf and for functional interactors, such as Agrp, Npas4a, Trpv1, Snap25a and Rgs4 downstream of GR function. Individual proteins are shown as nodes, edges are links between proteins signifying the various interaction data that support the interactions, all colouring is according to evidence type (see von Mering et al., 2007) and STRING website for colour legend.

The glucocorticoid receptor regulates depression-associated genes in adult zebrafish brain and stress-responsive locomotor behaviour in zebrafish larvae. (A) Enrichment analysis to identify diseases associated with human orthologues of GR-regulated genes by using the disgenet2r package to search the DisGeNET database. Human orthologues of zebrafish genes exhibiting significant differential expression in wild-type and GR-mutant adult brain samples were analysed using all data available in this database. A total of 678 diseases, symptoms and syndromes are significantly associated with orthologues of GR-regulated zebrafish genes; an adjusted false discovery rate (FDR) cut-off of P<0.05 was used (Table S6). The top ten diseases were selected based on FDR and then ranked according to the gene ratio. Unipolar depression ranked second after malignant neoplasm of soft tissue. (B) The top ten diseases within the Mental Disorders category of the DisGeNET database were identified using the disgenet2r package, selected based on FDR and then ranked according to the gene ratio. Anxiety disorders ranked first and unipolar depression fourth. (C,D) Group swimming analysis of zebrafish larvae at 5 days post fertilization under baseline and stressed conditions for nearest neighbour distance (NND) and swim speed. Panel C shows that the NND of wild-type groups increases under stress, whereas mutant groups have a higher NND than wild-type groups under baseline conditions and their NND is not affected by stress [two-way ANOVA followed by Tukey post-hoc test; genotype: treatment interaction, F=8.09, d.f.=1, 20 (P=0.01)]. Panel D shows that the swimming speed of wild-type groups is reduced under saline stress (NaCl), whereas GR-mutant groups swim slower than wild-type fish under baseline conditions and their swim speed is not affected by NaCl-induced stress [two-way ANOVA followed by Tukey post-hoc test; genotype: treatment interaction, F=14.41; d.f.=1, 20 (P=0.001)]. Wild-type and GR-mutant groups (both n=12) across two independent experiments. Plots show the mean±s.e.m. *P<0.05, **P<0.01, ***P<0.001.

fkbp5 is differentially expressed and differentially methylated in wild-type and GR-mutant zebrafish brains. (A) GR function is required for fkbp5 expression in the adult brain. Normalised transcript-count data for fkbp5 obtained from RNA-Seq analysis of wild-type and GR-mutant fish (both n=6) adult brains (P=3.45×10⁻²⁵). (B) GR function is required for fkbp5 expression in the adult brain. In situ hybridisation analysis of fkbp5 transcripts in transverse sections of adult zebrafish brain, cross section 149 (Wulliman et al., 1996) from wild-type (left panel) and GR-mutant (right panel) adult males, at a rostro-caudal position through the thalamus (CP, central posterior thalamic nucleus), the posterior tuberculum (TPp, periventricular nucleus of posterior tuberculum; PTN, posterior tuberal nucleus; PG, preglomerular nucleus) and the hypothalamus (Hd and Hv, dorsal and ventral zone of periventricular hypothalamus, respectively; LH, lateral hypothalamic nucleus). Results show fkbp5 expression in wild-type brain that is almost completely extinguished in the GR-mutant brain. Wild-type and GR-mutant (both n=6) fish, across three independent experiments. Scale bars: 100 μm. (C) Schematic of fkbp5, showing promoter region, exon 1 and intron1. Six distinct GR-binding sites (GREs) within the promoter region (GRE1, GRE2, GRE3), exon 1 (GRE4) and intron 1 (GRE5, GRE6) are shown in green. (D) Schematic of the differentially methylated region (DMR; pink) within fkbp5, surrounded either side by two 33-bp-long flanking sequences (orange). Four cytosine and guanine dinucleotides separated by a phosphate, i.e. CpG1, CpG2, CpG3, CpG4, are shown in green (see Fig. 2A for chromosome 6 nucleotide coordinates). Binding sites for transcription factors Rhoxf1, Jund, Nr2f1, Rxra, Creb1 and Pax4 overlap with CpGs, and are shown as blue bars. (E) Bar graph of data obtained by using the JASPAR database, indicating that CpG1 of the fkbp5 DMR is located within the binding motif for transcription factor RHOXF1, CpG2 is located within the binding motifs for transcription factors Creb1, Jund, Nr2f1 and Rxra, and CpG3 is located within the binding motif for transcription factor Pax4. Location of CpG4 is not located within a known transcription factor-binding motif. JASPAR matrix IDs are shown in grey within or to the right of each bar. DNA coordinates (nucleotide numbers) for each CpG within the fkbp5 intron 1 as depicted in panel D, are shown in black. The consensus sequence for the DNA-binding motif is shown to the left of each bar.

Acknowledgments
This image is the copyrighted work of the attributed author or publisher, and ZFIN has permission only to display this image to its users. Additional permissions should be obtained from the applicable author or publisher of the image. Full text @ Dis. Model. Mech.