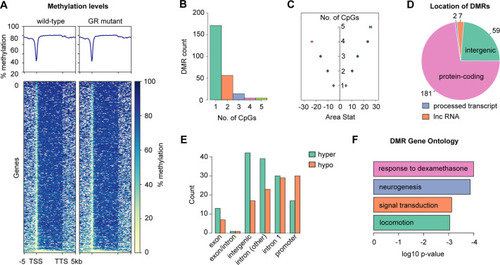
Whole-genome bisulphite sequencing (WGBS) analysis of wild-type and GR-mutant adult brain samples. (A) Graphs (top) indicating average DNA methylation (in %) across gene bodies and flanking sequences extending −5 kb upstream of the transcription start site (TSS) and +5 kb downstream of transcription termination site (TTS), in wild-type and GR-mutant adult brain samples analysed by WGBS. Heatmap (bottom) showing the distribution of methylated cytosine and guanine dinucleotides separated by a phosphate (CpGs) within gene bodies and flanking DNA sequences in wild-type and GR-mutant adult brain samples analysed by WGBS, covering the region from −5 kb upstream of the TSS to 5 kb downstream of the TTS, for the 1448 genes for which there was >95% coverage of CpGs within the plotted region. Deeper blue corresponds to a higher level of methylation. In wild-type (n=2) and GR-mutant (n=2) samples, gene bodies are typically highly methylated and promoters exhibit reduced or absent methylation, confirming that the global genomic DNA methylation patterns in the zebrafish brain samples analysed are similar to those previously described. (B) Histogram showing frequency distribution of DMRs identified by WGBS according to the number of CpGs within each DMR. Detailed summaries of all DMRs are provided in Table S1. (C) Plot of the number of CpGs within DMRs against the AreaStat measure of differential methylation (mean±s.e.m.). Negative values indicate DMRs that are hypomethylated and positive values indicate DMRs that are hypermethylated in GR-mutant adult male brain compared to that in wild-type fish. (D) Pie chart indicating the location of DMRs in relation to types of gene. The majority (181 of 249) DMRs are associated with protein-coding genes, some are intergenic, and a small number are associated with long non-coding RNAs (lncRNAs) or processed transcripts. (E) Histogram displaying the number of hypermethylated and hypomethylated DMRs associated with different locations in relation to genes. 47 DMRs are located within a putative gene promoter and 59 are located within the first intron. 22 DMRs are within an exon or a region that potentially pertains to an intron of one gene and an exon of another gene (labelled as exon/intron, whilst 62 DMRs are associated with an intron other than intron 1). (F) The top four slimmed (identified) Gene Ontology (GO) terms associated with biological processes enriched in GR-mutant versus wild-type methylome data. Identification was with the Princeton GO term finder, with a cut-off of P<0.05.
|
