
Fig. 6
- ID
- ZDB-FIG-230721-45
- Publication
- de Prisco et al., 2023 - Alternative polyadenylation alters protein dosage by switching between intronic and 3'UTR sites
- Other Figures
- All Figure Page
- Back to All Figure Page
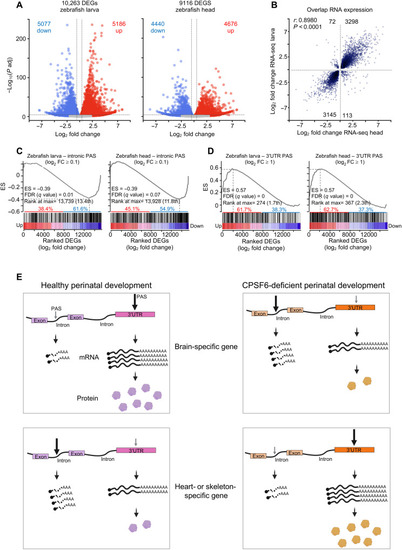
Gene expression changes correspond with PAS selection across species.
(A) Volcano plots of DEGs from cpsf6−/− larvae and heads compared to their WT stage-matched animals. The blue and red dots represent down- and up-regulated genes, respectively. DEGs are defined as having P adjusted < 0.05 and log2 FC > 0.263 (1.2 FC). (B) Scatterplot showing 97% correlation (r = 0.8980, P < 0.0001) between DEGs from cpsf6−/− larvae and heads, compared to their respective WT stage-matched animals. (C and D) Preranked GSEA of genes with intronic PAS usage (C) or 3′UTR PAS usage (D) intersected with DEGs from larvae and heads, ranked from the most up- to the most down-regulated gene. ES, enrichment score; the FDR and rank at max are calculated by GSEA. (E) Model of how cells may use APA to toggle between suppressing and augmenting protein abundance. In healthy perinatal development, a subset of genes involved in neuronal functions undergoes APA within the 3′UTR, which stabilizes the mRNA and up-regulates the resulting protein levels. A different subset of genes enriched in cardiac and skeletal development tend to undergo internal APA, generating short and unstable transcripts that result in down-regulation of protein levels. Loss of CPSF6 function causes these trends to switch. |