
Fig. 2
- ID
- ZDB-FIG-230721-41
- Publication
- de Prisco et al., 2023 - Alternative polyadenylation alters protein dosage by switching between intronic and 3'UTR sites
- Other Figures
- All Figure Page
- Back to All Figure Page
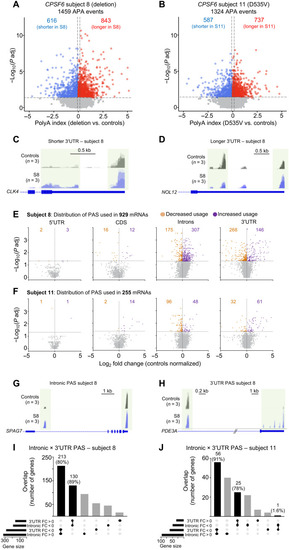
Loss of CPSF6 function globally affects APA.
(A and B) Differences in APA between subjects 8 (A) and 11 (B) compared to controls. The horizontal dashed lines indicate the −log10 (P adjusted) ≥ 1.325 (P adjusted ≤ 0.05), and the vertical dashed lines indicate polyA index ≥ +0.1 and ≤ −0.1, with positive values indicating longer transcripts and negative values indicating shorter transcripts. (C and D) Representative IGV tracks from subject 8 (S8) showing an example of longer and shorter 3′UTR. (C) CLK4 has a shorter 3′UTR than controls, and (D) NOL12 has a longer 3′UTR than controls. (E and F). Locations of PAS (5′UTR, CDS, introns, and 3′UTR) from subjects 8 and 11 fibroblasts relative to controls. Purple [log2 fold change (FC) > 0] and orange (log2 FC < 0) dots represent PAS usage in that location (n = 3 replicates for each subject). The horizontal and vertical dashed lines in (E) and (F) indicate the −log10 (P adjusted) ≥ 1.325 (P adjusted ≤ 0.05) and the log2 FC, respectively. (G and H) Representative IGV tracks from subject 8 (S8) showing SPAG7 switches from 3′UTR to intronic PAS usage, and PDE3A does the reverse. (I and J) Upset plots shows switching between internal and 3′UTR APA. Fold change compared to healthy controls. PAC-seq was performed on three independent biological samples from subjects 8 and 11 and their controls, each in triplicate. |