
Fig. 3
- ID
- ZDB-FIG-230721-42
- Publication
- de Prisco et al., 2023 - Alternative polyadenylation alters protein dosage by switching between intronic and 3'UTR sites
- Other Figures
- All Figure Page
- Back to All Figure Page
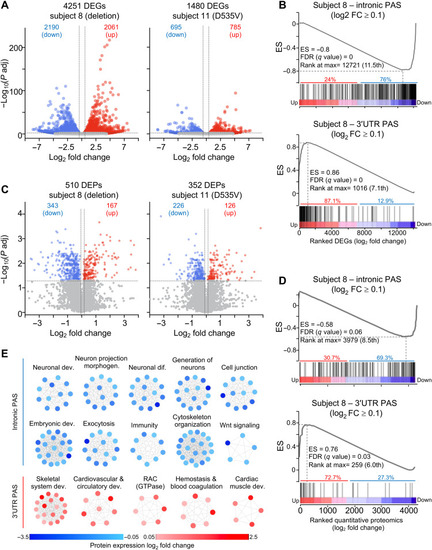
Intronic and 3′UTR PAS usage tracks with gene and protein expression change.
(A) Volcano plots of DEGs in fibroblasts from subjects 8 and 11 relative to age-matched controls (B) GSEA of preranked mRNA with intronic (top) or 3′UTR PAS usage (bottom) intersected with DEGs from subject 8 ranked from the most up-regulated to the most down-regulated gene. (C) DEPs in subjects 8 and 11 compared to three healthy age-matched controls, each in triplicate. (D) Preranked GSEA of mRNA with intronic PAS usage (top) and 3′UTR PAS usage (bottom) intersected with quantitative proteomics from subject 8 ranked from the most up-regulated to the most down-regulated protein. ES, GSEA enrichment score. FDR and rank at max are calculated by GSEA (see table S18). (E) Enriched biological categories of transcripts with intronic or 3′UTR PAS in subject 8. Notably, all mRNA undergoing intronic APA use were down-regulated (blue), whereas those undergoing 3′UTR APA resulted in up-regulated (red) protein expression. Each dot represents a protein belonging to a specific biological category. In (A) and (C), the vertical dashed lines indicate the log2 FC ≥ 0.263 (1.2 FC) for the up-regulated genes (A) or proteins (C) and log2 FC ≤ −0.263 (−1.2 FC) for the down-regulated genes (A) or proteins (C). The horizontal dashed line indicates the −log10 (P adjusted) ≥ 1.325 (P adjusted ≤ 0.05). |