
- Title
-
Alternative polyadenylation alters protein dosage by switching between intronic and 3'UTR sites
- Authors
- de Prisco, N., Ford, C., Elrod, N.D., Lee, W., Tang, L.C., Huang, K.L., Lin, A., Ji, P., Jonnakuti, V.S., Boyle, L., Cabaj, M., Botta, S., Õunap, K., Reinson, K., Wojcik, M.H., Rosenfeld, J.A., Bi, W., Tveten, K., Prescott, T., Gerstner, T., Schroeder, A., Fong, C.T., George-Abraham, J.K., Buchanan, C.A., Hanson-Khan, A., Bernstein, J.A., Nella, A.A., Chung, W.K., Brandt, V., Jovanovic, M., Targoff, K.L., Yalamanchili, H.K., Wagner, E.J., Gennarino, V.A.
- Source
- Full text @ Sci Adv
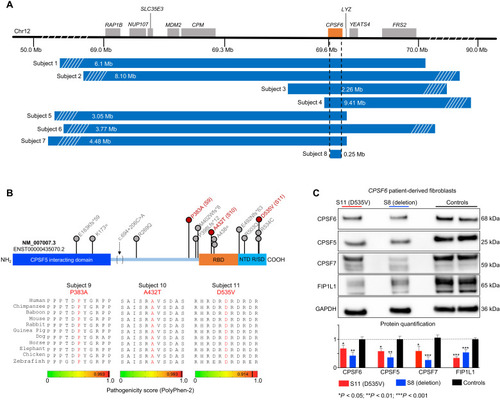
Heterozygous deletion and missense mutations reduce CPSF6 levels in patients.
(A) Deletions spanning CPSF6 (orange box) on chromosome 12q15 identified in eight subjects. Dashed lines indicate the minimal overlapping region, which deleted 99% of CPSF6 (subject 8). Mb, megabases. (B) Schematic of the CPSF6 protein showing the RNA binding domain (RBP; orange), the Arg/Ser-rich domain (R/SD) within the nuclear targeting domain (NTD; turquoise), and the CPSF5-interacting domain (blue). Database searches identified 15 individuals with 13 missense variants (indicated by lollipops), which are plotted here for context, but only subjects 9 to 11 (red) were enrolled in this study. Bottom: Evolutionary alignment shows that the three variants in our subjects affect residues that are conserved from zebrafish to humans and have high pathogenicity scores. See fig. S2 for details of the three splicing variants. (C) Representative Western blot and relative quantification shows that subjects 8 and 11 (the only subjects from whom we obtained fibroblasts) have lower CPSF6, CPSF5, CPSF7, and FIP1L1 protein levels than controls. Data were normalized to GAPDH(glyceraldehyde-3-phosphate dehydrogenase) protein. Data represent means ± SEM from at least four technical and biological replicates compared to healthy age-matched fibroblasts, *P < 0.05, **P < 0.01, and ***P < 0.001. |
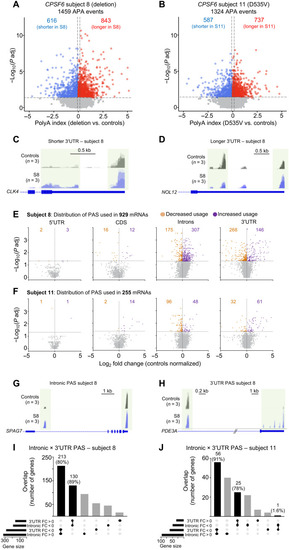
Loss of CPSF6 function globally affects APA.
(A and B) Differences in APA between subjects 8 (A) and 11 (B) compared to controls. The horizontal dashed lines indicate the −log10 (P adjusted) ≥ 1.325 (P adjusted ≤ 0.05), and the vertical dashed lines indicate polyA index ≥ +0.1 and ≤ −0.1, with positive values indicating longer transcripts and negative values indicating shorter transcripts. (C and D) Representative IGV tracks from subject 8 (S8) showing an example of longer and shorter 3′UTR. (C) CLK4 has a shorter 3′UTR than controls, and (D) NOL12 has a longer 3′UTR than controls. (E and F). Locations of PAS (5′UTR, CDS, introns, and 3′UTR) from subjects 8 and 11 fibroblasts relative to controls. Purple [log2 fold change (FC) > 0] and orange (log2 FC < 0) dots represent PAS usage in that location (n = 3 replicates for each subject). The horizontal and vertical dashed lines in (E) and (F) indicate the −log10 (P adjusted) ≥ 1.325 (P adjusted ≤ 0.05) and the log2 FC, respectively. (G and H) Representative IGV tracks from subject 8 (S8) showing SPAG7 switches from 3′UTR to intronic PAS usage, and PDE3A does the reverse. (I and J) Upset plots shows switching between internal and 3′UTR APA. Fold change compared to healthy controls. PAC-seq was performed on three independent biological samples from subjects 8 and 11 and their controls, each in triplicate. |
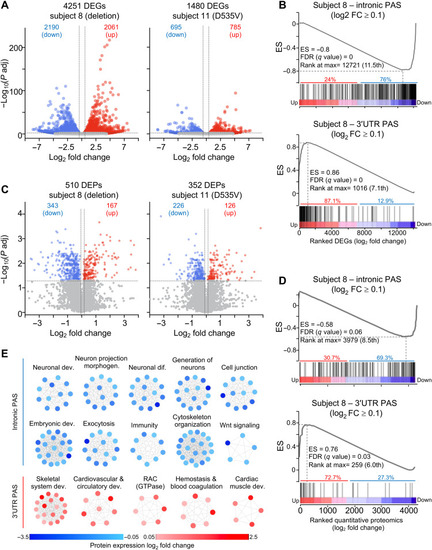
Intronic and 3′UTR PAS usage tracks with gene and protein expression change.
(A) Volcano plots of DEGs in fibroblasts from subjects 8 and 11 relative to age-matched controls (B) GSEA of preranked mRNA with intronic (top) or 3′UTR PAS usage (bottom) intersected with DEGs from subject 8 ranked from the most up-regulated to the most down-regulated gene. (C) DEPs in subjects 8 and 11 compared to three healthy age-matched controls, each in triplicate. (D) Preranked GSEA of mRNA with intronic PAS usage (top) and 3′UTR PAS usage (bottom) intersected with quantitative proteomics from subject 8 ranked from the most up-regulated to the most down-regulated protein. ES, GSEA enrichment score. FDR and rank at max are calculated by GSEA (see table S18). (E) Enriched biological categories of transcripts with intronic or 3′UTR PAS in subject 8. Notably, all mRNA undergoing intronic APA use were down-regulated (blue), whereas those undergoing 3′UTR APA resulted in up-regulated (red) protein expression. Each dot represents a protein belonging to a specific biological category. In (A) and (C), the vertical dashed lines indicate the log2 FC ≥ 0.263 (1.2 FC) for the up-regulated genes (A) or proteins (C) and log2 FC ≤ −0.263 (−1.2 FC) for the down-regulated genes (A) or proteins (C). The horizontal dashed line indicates the −log10 (P adjusted) ≥ 1.325 (P adjusted ≤ 0.05). |
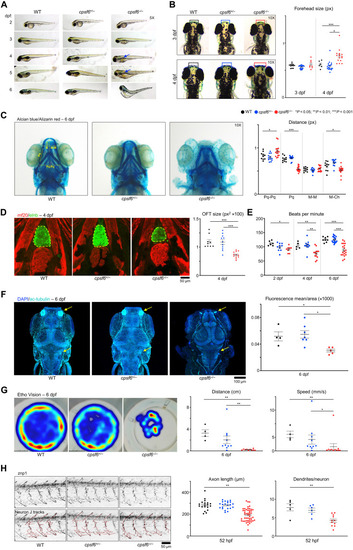
Cpsf6 deficiency in zebrafish produces skeletal, neurological, and cardiac defects.
(A) Larval development of wild-type (WT), cpsf6+/−, and cpsf6−/− animals. Arrows point to where the missing swim bladder should be. Images acquired in brightfield with a 5× objective lens. (B) Dorsal images at 3 and 4 dpf, with the regions quantified at right in boxes. Images acquired in brightfield with 10× objective. (C) Ventral views of larvae at 6 dpf stained with Alcian blue and Alizarin red (24) with relative quantification of cartilage length. Pq, palatoquadrate; Pq-Pq, distance between right and left Pq; M-M, Meckel’s cartilage; M-Ch, distance between M and the Ceratohyal (78). (D) Immunofluorescence (IF) confocal microscopy with MF20 (79) (red, ventricular cardiomyocytes) and elnb (80) (green, outflow tract). Yellow dashed line encircles Outflow tract (OFT), quantified at the right. (E) Heart rate quantification (see also movies S1 to S9). (F) IF confocal images with staining for acetylated tubulin (81) and relative quantification of mean ac-tubulin fluorescence normalized by the analyzed area. Nuclei were counterstained with 4′,6-diamidino-2-phenylindole (DAPI). (G) Density map of the free-swimming test acquired with EthoVision, quantifying distance and speed. (H) Confocal images of the znp1 pMN marker (75), with relative quantification of axonal length and dendritic density. Each dot represents one animal in (B) to (G) and (H) (dendrites/neuron graph); each dot in axon length graph [also in (H)] represents one neuron (total of 84, from 5 WT, 6 cpsf6+/−, and 12 cpsf6−/− animals). Data represent mean ± SEM. One-way analysis of variance (ANOVA); *P < 0.05, **P < 0.01, ***P < 0.001. |
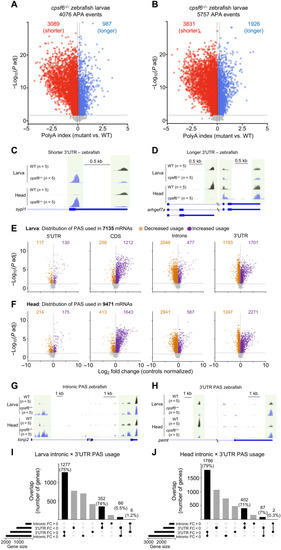
Cpsf6−/− zebrafish show altered PAS usage in larvae and head.
(A and B) Volcano plots show APA change in cpsf6−/− larvae (A) and heads (B) compared to WT age-matched siblings. The horizontal and vertical dashed lines in (A) and (B) indicate the −log10 (P adjusted) ≥ 1.325 (P adjusted ≤ 0.05) and polyA index ≥+0.1 and ≤−0.1, respectively. (C and D) Representative IGV tracks for shorter (C) and longer (D) 3′UTRs. Light green boxes highlight the polyA site used. (E and F) Volcano plots showing the polyA read distribution in 5′UTR, CDS, introns, and 3′UTR from cpsf6−/− larvae (E) and heads (F), compared to WT stage-matched larvae and heads, respectively. Each dot represents a transcript with greater (purple, log2 FC > 0) or lesser (orange, log2 FC < 0) PAS usage in a certain location. The horizontal and vertical dashed lines in (E) and (F) indicate the −log10 (P adjusted) ≥ 1.325 (P adjusted ≤ 0.05) and the log2 FC, respectively. (G and H) Representative IGV tracks for intronic PAS usage (G) and 3′UTR PAS usage (H). (I) In cpsf6−/− larvae, 75% of the mRNA undergoing 3′UTR APA in mutant underwent intronic APA WT, while 74% switch in the other direction. (J) In cpsf6−/− heads, 79% of mRNA that had 3′UTR APA underwent intronic APA in controls, and 71% switch from intronic to 3′UTR APA in controls. PAC-seq was performed on 10 (five larvae and five heads) independently collected groups of cpsf6−/− compared to 10 WT stage-matched animals. Each group of animals was composed of 30 to 40 larvae or 40 to 50 heads. |
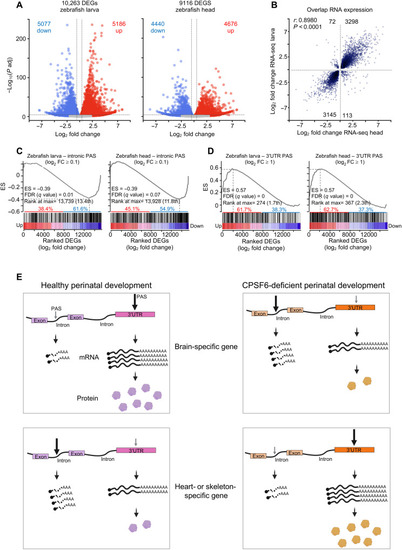
Gene expression changes correspond with PAS selection across species.
(A) Volcano plots of DEGs from cpsf6−/− larvae and heads compared to their WT stage-matched animals. The blue and red dots represent down- and up-regulated genes, respectively. DEGs are defined as having P adjusted < 0.05 and log2 FC > 0.263 (1.2 FC). (B) Scatterplot showing 97% correlation (r = 0.8980, P < 0.0001) between DEGs from cpsf6−/− larvae and heads, compared to their respective WT stage-matched animals. (C and D) Preranked GSEA of genes with intronic PAS usage (C) or 3′UTR PAS usage (D) intersected with DEGs from larvae and heads, ranked from the most up- to the most down-regulated gene. ES, enrichment score; the FDR and rank at max are calculated by GSEA. (E) Model of how cells may use APA to toggle between suppressing and augmenting protein abundance. In healthy perinatal development, a subset of genes involved in neuronal functions undergoes APA within the 3′UTR, which stabilizes the mRNA and up-regulates the resulting protein levels. A different subset of genes enriched in cardiac and skeletal development tend to undergo internal APA, generating short and unstable transcripts that result in down-regulation of protein levels. Loss of CPSF6 function causes these trends to switch. |