
Fig. 4
- ID
- ZDB-FIG-230721-43
- Publication
- de Prisco et al., 2023 - Alternative polyadenylation alters protein dosage by switching between intronic and 3'UTR sites
- Other Figures
- All Figure Page
- Back to All Figure Page
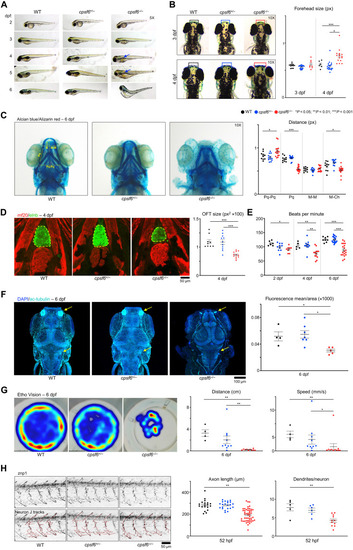
Cpsf6 deficiency in zebrafish produces skeletal, neurological, and cardiac defects.
(A) Larval development of wild-type (WT), cpsf6+/−, and cpsf6−/− animals. Arrows point to where the missing swim bladder should be. Images acquired in brightfield with a 5× objective lens. (B) Dorsal images at 3 and 4 dpf, with the regions quantified at right in boxes. Images acquired in brightfield with 10× objective. (C) Ventral views of larvae at 6 dpf stained with Alcian blue and Alizarin red (24) with relative quantification of cartilage length. Pq, palatoquadrate; Pq-Pq, distance between right and left Pq; M-M, Meckel’s cartilage; M-Ch, distance between M and the Ceratohyal (78). (D) Immunofluorescence (IF) confocal microscopy with MF20 (79) (red, ventricular cardiomyocytes) and elnb (80) (green, outflow tract). Yellow dashed line encircles Outflow tract (OFT), quantified at the right. (E) Heart rate quantification (see also movies S1 to S9). (F) IF confocal images with staining for acetylated tubulin (81) and relative quantification of mean ac-tubulin fluorescence normalized by the analyzed area. Nuclei were counterstained with 4′,6-diamidino-2-phenylindole (DAPI). (G) Density map of the free-swimming test acquired with EthoVision, quantifying distance and speed. (H) Confocal images of the znp1 pMN marker (75), with relative quantification of axonal length and dendritic density. Each dot represents one animal in (B) to (G) and (H) (dendrites/neuron graph); each dot in axon length graph [also in (H)] represents one neuron (total of 84, from 5 WT, 6 cpsf6+/−, and 12 cpsf6−/− animals). Data represent mean ± SEM. One-way analysis of variance (ANOVA); *P < 0.05, **P < 0.01, ***P < 0.001. |
| Antibodies: | |
|---|---|
| Fish: | |
| Anatomical Terms: | |
| Stage Range: | Long-pec to Day 6 |
| Fish: | |
|---|---|
| Observed In: | |
| Stage Range: | Long-pec to Day 6 |