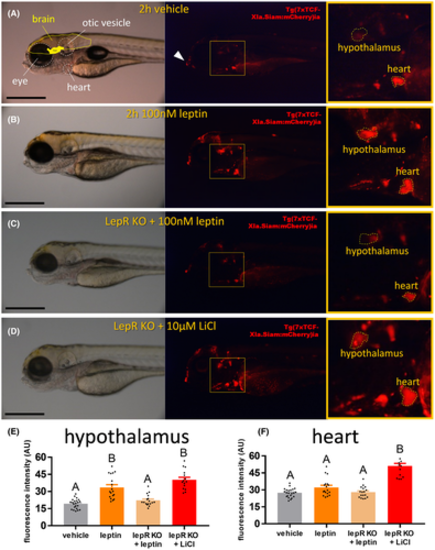
Wnt pathway activation by leptin in Tg(7xTCFXla. Siam:nlsmCherry)ia5 larvae. (A) 5 dpf Tg(7xTCFXla. Siam:nlsm Cherry)ia5 larvae treated with vehicle (Cortland salt solution). Left: bright field image, with anatomical landmarks encircled; Middle: Epifluorescence image, with white arrow indicating teeth protrusion; Right: Magnification of yellow box in middle image, with hypothalamus and heart encircled. Scale bar = 500 μM. (B) 5 dpf Tg(7xTCFXla. Siam:nlsm Cherry)ia5 larvae treated with 100 nM recombinant leptin for 2 h. (C) 5 dpf CRISPR-mediated leptin receptor-deficient Tg(7xTCFXla. Siam:nlsm Cherry)ia5 larvae treated with 100 nM recombinant leptin for 2 h. (D) 5 dpf CRISPR-mediated leptin receptor-deficient Tg(7xTCFXla. Siam:nlsm Cherry)ia5 larvae treated with 10 μM LiCl for 2 h. (E) Fluorescence intensity in the hypothalamus of differentially treated 5 dpf Tg(7xTCF-Xla. Siam:nlsmCherry)ia5 larvae. A–B = p < .05, one-way ANOVA. (F) Fluorescence intensity in the heart of differentially treated 5 dpf Tg(7xTCF-Xla. Siam:nlsmCherry)ia5 larvae. A–B = p < .05, one-way ANOVA
|
