
- Title
-
Leptin regulates glucose homeostasis via the canonical Wnt pathway in the zebrafish
- Authors
- Kamstra, K., Rizwan, M.Z., Grattan, D.R., Horsfield, J.A., Tups, A.
- Source
- Full text @ FASEB J.
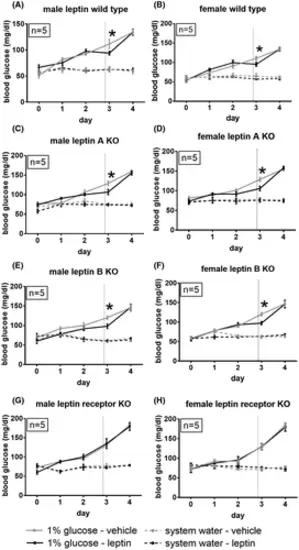
Leptin treatment ameliorates hyperglycemia in male and female zebrafish. (A, B) Blood glucose values of male (right) and female (left) wild-type zebrafish over time following immersion in a 1% glucose solution. On the third day, 1 h before blood sampling, fish were injected intraperitoneally with recombinant mouse leptin (2 mg/kg) or vehicle. *p < .05, repeated-measures one-way ANOVA. Data are displayed as mean ± SEM. (C, D) Male (right) and female (left) lepanz301 fish. (E, F) Male (right) and female (left) lepbnz302 fish. (G, H) Male (right) and female (left) leprnz303 fish PHENOTYPE:
|
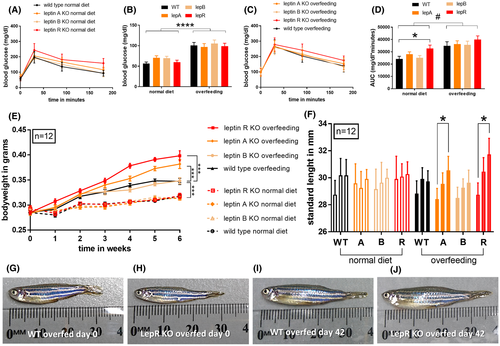
Regulation of glucose homeostasis and body weight in adult zebrafish. (A) Glucose tolerance in normal-fed lepanz301 fish, lepbnz302 fish, leprnz303 fish, and wild-type controls (n = 12). (B) Baseline blood glucose levels of normal-fed and overfed lepanz301 fish, lepbnz302 fish, leprnz303 fish, and wild-type controls. ****p < .0001, two-way ANOVA. (C) Glucose tolerance in overfed lepanz301 fish, lepbnz302 fish, leprnz303 fish, and wild-type controls (n = 12). (D) Area under the curve of (A) and (C). *p < .05, one-way ANOVA; #p < .05, two-way ANOVA. (E) Body weights of lepanz301 fish, lepbnz302 fish, leprnz303 fish, and wild-type control on a 6-week normal diet or overfeeding regime. ***p < .001, repeated-measures ANOVA. (F) Standard length of normal-fed and overfed lepanz301 fish, lepbnz302 fish, leprnz303 fish, and wild-type controls at 0, 3, and 6 weeks. *p < .05, one-way ANOVA. (G–J) Examples of leptin receptor-deficient and wild-type zebrafish at the start and end of the overfeeding regime PHENOTYPE:
|
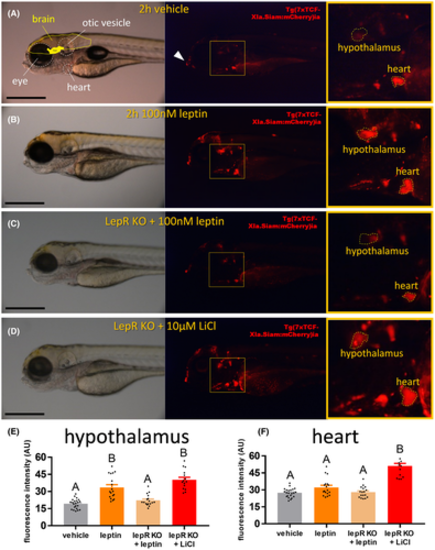
Wnt pathway activation by leptin in Tg(7xTCFXla. Siam:nlsmCherry)ia5 larvae. (A) 5 dpf Tg(7xTCFXla. Siam:nlsm Cherry)ia5 larvae treated with vehicle (Cortland salt solution). Left: bright field image, with anatomical landmarks encircled; Middle: Epifluorescence image, with white arrow indicating teeth protrusion; Right: Magnification of yellow box in middle image, with hypothalamus and heart encircled. Scale bar = 500 μM. (B) 5 dpf Tg(7xTCFXla. Siam:nlsm Cherry)ia5 larvae treated with 100 nM recombinant leptin for 2 h. (C) 5 dpf CRISPR-mediated leptin receptor-deficient Tg(7xTCFXla. Siam:nlsm Cherry)ia5 larvae treated with 100 nM recombinant leptin for 2 h. (D) 5 dpf CRISPR-mediated leptin receptor-deficient Tg(7xTCFXla. Siam:nlsm Cherry)ia5 larvae treated with 10 μM LiCl for 2 h. (E) Fluorescence intensity in the hypothalamus of differentially treated 5 dpf Tg(7xTCF-Xla. Siam:nlsmCherry)ia5 larvae. A–B = p < .05, one-way ANOVA. (F) Fluorescence intensity in the heart of differentially treated 5 dpf Tg(7xTCF-Xla. Siam:nlsmCherry)ia5 larvae. A–B = p < .05, one-way ANOVA |
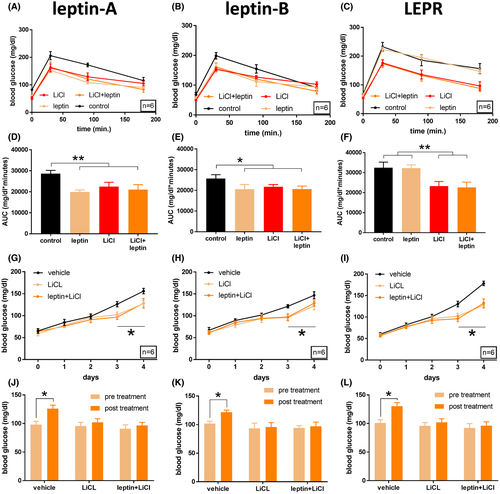
Activation of canonical Wnt signaling improves glucose tolerance in lepanz301 fish, lepbnz302 fish, and leprnz303 zebrafish. (A) Glucose tolerance of adult male lepanz301 zebrafish (n = 6). Fish were treated 10 μM LiCl (3 h before glucose injection), 0.6 g/L of recombinant mouse leptin dissolved in Cortland salt solution (1 h before glucose injection), vehicle only, or a combination of LiCl and leptin. Following 0.5 mg/g glucose injection, blood samples were taken at 30, 90, and 180 min post-injection. (B) Same as (A), but for lepbnz302 fish. (C) Same as (A) and (B), but for leprnz303 fish. (D) Area under the curve of (A). **p < .001, one-way ANOVA. (E) Area under the curve of (B). *p < .05, one-way ANOVA. (F) Area under the curve of (C). **p < .001, one-way ANOVA. (G) Blood glucose values of adult male lepanz301 zebrafish (n = 6) over the course of a 4-day immersion in a 1% glucose solution. On the third day, fish were exposed to 10 μM LiCl for three h before daily blood sampling. One hour before blood sampling, fish were injected intraperitoneally with 0.6 g/L of recombinant mouse leptin dissolved in Cortland salt solution, or with vehicle only. *p < .05, repeated-measures ANOVA. (H) Same as (G), but for lepbnz302 fish. *p < .05, repeated-measures ANOVA. (I) Same as (G) and (H), but for leprnz303 fish. *p < .05, repeated-measures ANOVA. (J) Blood glucose levels of (G), comparing pre-treatment (day 2) and post-treament (day 3). (K) Same as (J) but relating to (H). (L) Same as (J) and (K) but relating to (I) PHENOTYPE:
|
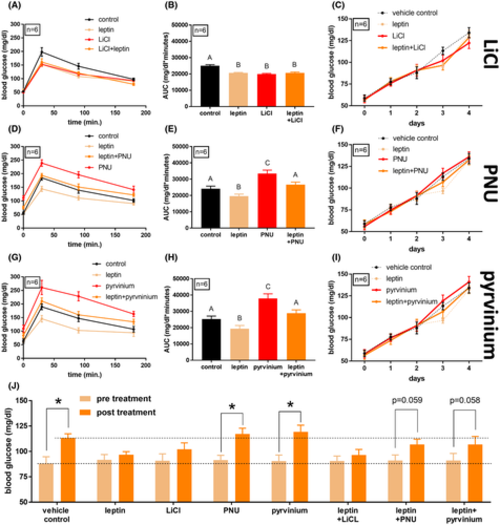
Glucose tolerance in wild-type zebrafish following Wnt pathway manipulation and leptin treatment. (A) Glucose tolerance of adult wild-type male zebrafish (n = 6). Fish were treated 10 μM LiCl (3 h before glucose injection), 0.6 g/L of recombinant mouse leptin dissolved in Cortland salt solution (1 h before glucose injection), vehicle only, or a combination of LiCl and leptin. Following 0.5 mg/g glucose injection, blood samples were taken at 30, 90, and 180 min post-injection. (B) Area under the curve of (A). A–B = p < .05, one-way ANOVA. (C) Blood glucose values of adult wild-type male zebrafish (n = 6) over the course of a 4-day immersion in a 1% glucose solution. On the third day, fish were exposed to 10 μM LiCl for 3 h before daily blood sampling. One hour before blood sampling, fish were injected intraperitoneally with 0.6 r/L of recombinant mouse leptin dissolved in Cortland salt solution, or with vehicle only. (D) Glucose tolerance of adult wild-type male zebrafish (n = 6). Fish were treated 10 μM PNU74654 (3 h before glucose injection), 0.6 g/L of recombinant mouse leptin dissolved in Cortland salt solution (1 h before glucose injection), vehicle only, or a combination of PNU74654 and leptin. (E) Area under the curve of (D). A–B and A–C = p < .05, one-way ANOVA. (F) Blood glucose values of adult wild-type male zebrafish (n = 6) over the course of a 4-day immersion in a 1% glucose solution with exposure to 10 μM PNU74654. (G) Glucose tolerance of adult wild-type male zebrafish (n = 6). Fish were treated with 10 μM pyrvinium pamoate (3 h before glucose injection), 0.6 g/L of recombinant mouse leptin dissolved in Cortland salt solution (1 h before glucose injection), vehicle only, or a combination of pyrvinium pamoate and leptin. (H) Area under the curve of (G). A–B and A–C = p < .05, one-way ANOVA. (I) Blood glucose values of adult wild-type male zebrafish (n = 6) over the course of a 4-day immersion in a 1% glucose solution with exposure to 10 μM pyrvinium pamoate. (J) Comparison of blood glucose levels in (C), (F), and (I), pre-treatment (day 2), and post-treatment (day 3). *p < .05, repeated-measures ANOVA PHENOTYPE:
|