
Fig. 3
- ID
- ZDB-FIG-221031-3
- Publication
- Sengupta et al., 2021 - Spinal V1 neurons inhibit motor targets locally and sensory targets distally
- Other Figures
- All Figure Page
- Back to All Figure Page
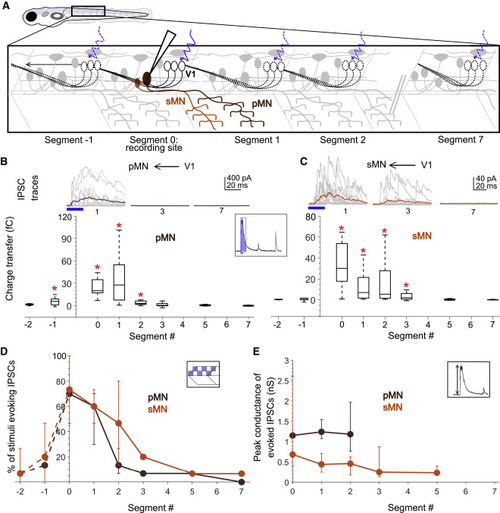
Figure 3. Motor neurons receive input only from local V1 neurons (A) Schematic of the experimental design showing intracellular recordings from primary (brown) and secondary (orange) motor neurons paired with optical stimulation of V1 neurons (black) along the rostro-caudal axis. (B) Top: representative overlay of 15 traces of IPSCs recorded in a primary motor neuron (pMN) during illumination of segments 1, 3, and 7 caudal to the recorded neuron soma. Colored trace represents mean. Duration of the optical stimulus is shown as a blue bar. Bottom: boxplots show total charge transfer per segment (inset, illustration) recorded in primary motor neurons. In this and subsequent figures, the box shows the median, 25th, and 75th percentile values; whiskers show ±2.7σ. Red asterisks mark segments that were significantly different from noise (p < 0.01). n = 8–26 neurons for each data point. (C) Same as in (B) for secondary motor neurons (sMNs). n = 10–11 neurons for each data point. (D and E) Comparison of the percent of squares in the optical stimulus grid that evoked IPSCs (D) and the peak conductance of IPSCs (E) in primary (brown) and secondary (orange) motor neurons. Here and in subsequent figures, circles represent median values and error bars indicate the 25th and 75th percentiles. n = 8–26 pMNs and 11 sMNs. See also Figure S3. |