
Fig. 2
- ID
- ZDB-FIG-221031-2
- Publication
- Sengupta et al., 2021 - Spinal V1 neurons inhibit motor targets locally and sensory targets distally
- Other Figures
- All Figure Page
- Back to All Figure Page
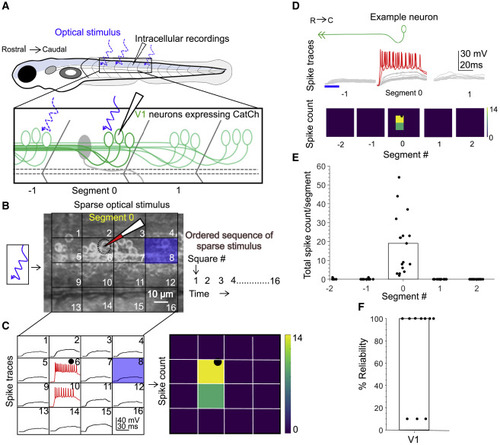
Figure 2. Calibration of V1 spiking evoked by optical stimulus (A) Schematic of the experimental setup showing targeted intracellular recording and optical stimulation in Tg(eng1b:Gal4,UAS:CatCh) animals. (B) Schematic of the patterned optical stimulus. A 4 × 4 grid was overlaid on approximately one segment, and each square in the grid (blue square) was optically stimulated in an ordered sequence (right). Position of the recorded cell is shown as a dotted black circle. (C) Illustration of the analysis. Intracellular recordings elicited from optical stimulation in each grid square (left) are shown. Spiking is denoted in red. Same data are shown as a heatmap and superimposed on the optical stimulus grid (right). Position of the recorded cell is indicated with a black circle. (D) V1 responses evoked by optical stimuli in segments rostral or caudal to the recorded neuron. Representative traces of activity (top) and spike count (bottom) of the same V1 neuron while the optical stimulation was moved along the rostro-caudal axis are shown. Red traces indicate spiking. Blue bar indicates duration of the optic stimulus. (E) Quantification of spiking in V1 neurons as the optical stimulus is presented along the rostro-caudal axis. n = 17 neurons. Bar indicates median value. (F) Reliability of spiking in these neurons with multiple trials of the same optical stimulus. n = 10 neurons. Bar indicates median value. See also Figure S2. |