
Fig. 1
- ID
- ZDB-FIG-221031-1
- Publication
- Sengupta et al., 2021 - Spinal V1 neurons inhibit motor targets locally and sensory targets distally
- Other Figures
- All Figure Page
- Back to All Figure Page
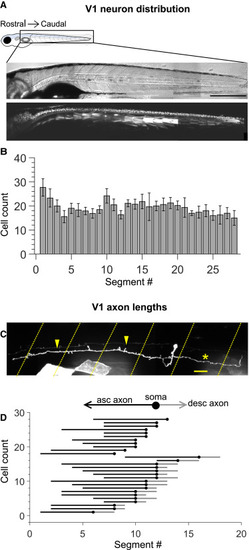
Figure 1. Engrailed+ V1 neurons project long, primarily ascending axons (A) Montaged transmitted light images (top) and confocal images (bottom) of a 5-days post fertilization (dpf) Tg (eng1b:Gal4,UAS:GFP) larva. In this and subsequent figures, rostral is to the left and dorsal to the top. Some non-specific expression of GFP is present in muscle fibers as well. Scale bar, 0.5 mm. (B) Bar plot showing mean cell count of V1 neurons per segment along the rostro-caudal axis. n = 15 larvae from 4 clutches. Error bars represent SEM. (C) Representative example of a sparsely labeled V1 neuron in a mid-body segment. Segment borders are shown in yellow dashed lines. Arrowheads mark the ascending axon, and the asterisk marks the descending axon. Scale bar, 20 μm. (D) Ball and stick plots representing the soma (ball) and ascending and descending axon lengths of V1 neurons (sticks) relative to body segments. n = 28 neurons from N = 18 larvae. See also Figure S1. |