
Figure S2
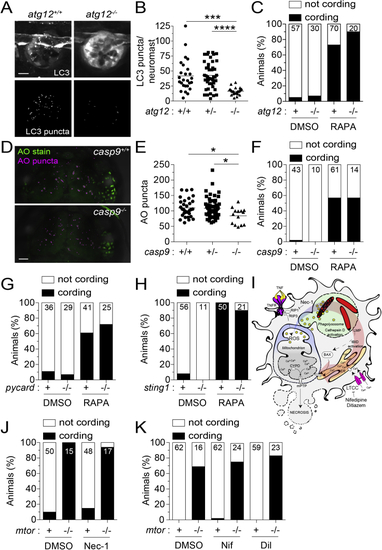
Inhibition of autophagic cell death, mitochondrial apoptosis, or TNF-associated necrosis does not prevent mycobacterium-induced macrophage death in mTOR-deficient animals, related to (A) Confocal micrographs of LC3 aggregation in neuromasts, clusters of mechanosensory cells of the fish lateral line, from (B) Number of LC3 puncta per neuromast. (C) Cording in rapamycin- or DMSO-treated (D) Confocal micrographs of acridine orange (AO) staining (green) and surface-rendered puncta (magenta) in the midbrain of (E) Number of AO puncta in the midbrain. (F) Cording in rapamycin- or DMSO-treated (G) Cording in rapamycin- and DMSO-treated (H) Cording in rapamycin- and DMSO-treated (I) Necrosis pathway induced by mycobacterial infection plus excess TNF and pharmacological interventions tested. (J and K) Mycobacterial cording in Symbols represent individual (B) neuromasts or (E) animals. (B and E) Horizontal lines indicate mean values. (C, F–H, J, and K) Numbers within columns indicate animals per group. (B and E) One-way ANOVA with Tukey’s post-test. |
Reprinted from Cell, 185(20), Pagán, A.J., Lee, L.J., Edwards-Hicks, J., Moens, C.B., Tobin, D.M., Busch-Nentwich, E.M., Pearce, E.L., Ramakrishnan, L., mTOR-regulated mitochondrial metabolism limits mycobacterium-induced cytotoxicity, 3720-3738.e13, Copyright (2022) with permission from Elsevier. Full text @ Cell