
Figure S3
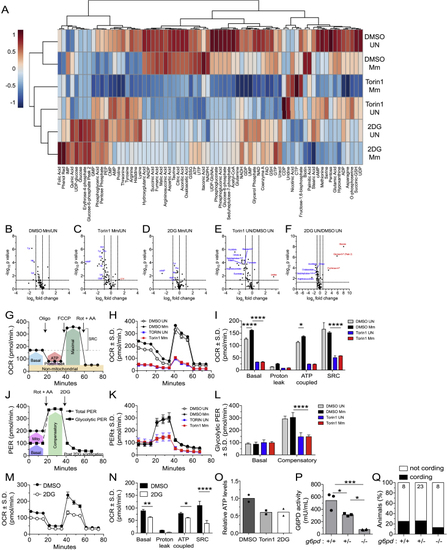
mTOR inhibition impairs glycolysis and mitochondrial metabolism, related to (A) Metabolite profiles of uninfected and Mm-infected THP-1 macrophages 1 dpi (MOI = 1). Cell were treated with torin1 (400 nM), 2DG (5 mM), or 0.5% DMSO for 1.5 days prior to harvest. Heat map scale indicates relative log2 expression levels. See also (B–F) Volcano plots of differences in metabolite abundances induced by the indicated treatments. Dashed lines indicate fold-change and p value cutoffs. (G) Diagram of mitochondrial oxygen consumption rate (OCR) assay. (H) OCR kinetics of torin1 or DMSO-treated THP-1 macrophages 1 dpi (Mm, MOI = 4). (I) Modular analysis of mitochondrial OCR. (J) Diagram of glycolytic proton efflux rate (PER) assay. (K) PER kinetics of torin1 or DMSO-treated THP-1 macrophages 1 dpi (Mm, MOI = 4). (L) Basal and compensatory glycolytic PER. (M) OCR kinetics of uninfected THP-1 macrophages treated with 2DG or DMSO for 1.5 days. (N) Modular analysis of mitochondrial OCR. (O) Relative ATP levels in THP-1 macrophage cultures 1.5 days after treatment. (P) Glucose-6-phosphate dehydrogenase (G6PD) activity in 5 dpf animals from (Q) Cording in animals from Symbols represent (B–F) individual metabolites, (H, K, and M) mean values, (O) individual wells, or (P) individual animals. (I, L, and N–P) Bars indicate mean values. (H, I, and K–N) Error bars depict standard deviation. (G and J) Arrows indicate the time of compound injection. Abbreviations: rotenone plus antimycin A (Rot + AA), 2DG, oligomycin (Oligo), carbonyl cyanide 4-(trifluoromethoxy)phenylhydrazone (FCCP), compensatory glycolysis (Comp), spare respiratory capacity (SRC). Statistical significance, (B–F) unpaired Students’ t test, one-way ANOVA with (I, L, and N) Sidak or (P) Tukey’s post-tests. |
Reprinted from Cell, 185(20), Pagán, A.J., Lee, L.J., Edwards-Hicks, J., Moens, C.B., Tobin, D.M., Busch-Nentwich, E.M., Pearce, E.L., Ramakrishnan, L., mTOR-regulated mitochondrial metabolism limits mycobacterium-induced cytotoxicity, 3720-3738.e13, Copyright (2022) with permission from Elsevier. Full text @ Cell