
Figure S4
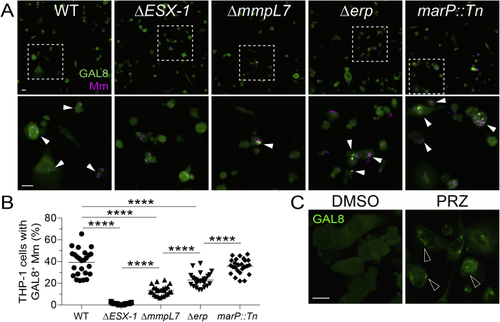
Damage of phagosomal/lysosomal compartments by ESX-1-competent mycobacteria and the drug prazosin, related to (A) Confocal micrographs of galectin-8 (GAL8) immunofluorescence (green) and Mm fluorescence (magenta) in THP-1 macrophages infected with the indicated Mm strains (MOI = 1) 1 dpi. The (B) Percentage of macrophages with foci of GAL8-associated Mm. Symbols represent values from individual imaging fields. Horizontal bars indicate mean values. One-way ANOVA with Tukey’s post-test. (C) Confocal micrographs of GAL8 immunofluorescence 7 h after treatment with prazosin (PRZ, 20 μM) or 0.5% DMSO. Arrowheads indicate GAL8 puncta. Scale bars, 20 μm. |
Reprinted from Cell, 185(20), Pagán, A.J., Lee, L.J., Edwards-Hicks, J., Moens, C.B., Tobin, D.M., Busch-Nentwich, E.M., Pearce, E.L., Ramakrishnan, L., mTOR-regulated mitochondrial metabolism limits mycobacterium-induced cytotoxicity, 3720-3738.e13, Copyright (2022) with permission from Elsevier. Full text @ Cell