
Figure 4
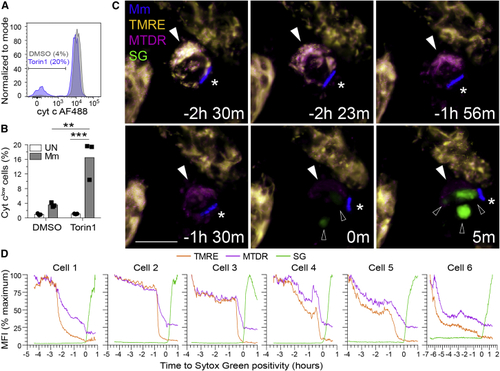
mTOR deficiency promotes mycobacterium-induced, mitochondrially mediated cell death (A and B) THP-1 macrophages were infected with (A and B) tdTomato- or (C and D) BFP-expressing Mm at MOI = 3. (A) Flow cytometry histograms of cytochrome (B) Quantification of cyt clow cells 7 hpi. (C and D) Torin1-treated THP-1 macrophages were labeled with TMRE and MitoTracker Deep Red prior to imaging in the presence of Sytox Green 32 hpi. See (C) Confocal micrographs of a dying infected macrophage (filled arrowhead) surrounded by surviving uninfected macrophages. Mm (asterisk), Sytox Green (open arrowheads). Scale bars, 10 μm. (D) MFI of TMRE, MitoTracker Deep Red, and Sytox Green staining of dying infected macrophages over time. Key time-lapse frames for cell 1 are shown in (C). Statistical analyses, (B) two-way ANOVA with Tukey’s post-test. |
Reprinted from Cell, 185(20), Pagán, A.J., Lee, L.J., Edwards-Hicks, J., Moens, C.B., Tobin, D.M., Busch-Nentwich, E.M., Pearce, E.L., Ramakrishnan, L., mTOR-regulated mitochondrial metabolism limits mycobacterium-induced cytotoxicity, 3720-3738.e13, Copyright (2022) with permission from Elsevier. Full text @ Cell