
Figure 7
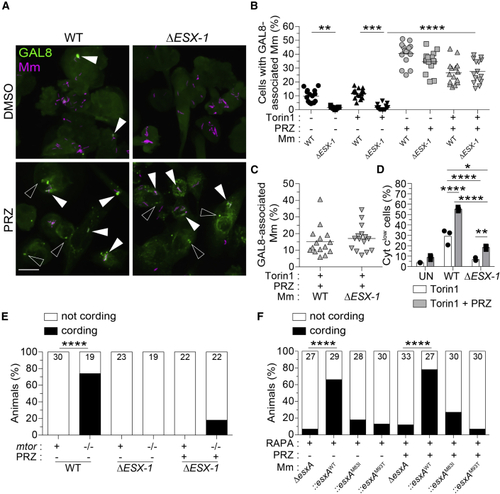
ESAT-6 mediates mitochondrial damage in mTOR-deficient macrophages downstream of its involvement in phagosomal permeabilization (A–E) Torin1- and DMSO-treated THP-1 macrophages were infected with tdTomato-expressing WT or Δ (A) Confocal micrographs of galectin-8 (GAL8) immunofluorescence (green) and Mm fluorescence (magenta) in THP-1 macrophages 7 hpi. GAL8 foci associated with Mm (filled arrowheads) or not associated with Mm (open arrowheads) are shown. Scale bar, 20 μm. (B) Percentage of macrophages with GAL8-associated Mm foci. (C) Percentage of Mm volume associated with GAL8 foci 7 hpi. (D) Percentage of cells that have released cytochrome (E) (F) Wild-type fish treated with 400 nM rapamycin were infected with ∼180 tdTomato-expressing Symbols represent values from individual (B and C) imaging fields or (D) individual wells. (B and C) Horizontal lines and (D) bars indicate mean values. (E and F) Numbers within columns indicate animals per group. Statistical analyses, (B and D) one-way ANOVA with Sidak’s post-test or (E and F) Fisher’s exact test. See also |
| Fish: | |
|---|---|
| Conditions: | |
| Observed In: | |
| Stage Range: | Long-pec to Day 5 |
Reprinted from Cell, 185(20), Pagán, A.J., Lee, L.J., Edwards-Hicks, J., Moens, C.B., Tobin, D.M., Busch-Nentwich, E.M., Pearce, E.L., Ramakrishnan, L., mTOR-regulated mitochondrial metabolism limits mycobacterium-induced cytotoxicity, 3720-3738.e13, Copyright (2022) with permission from Elsevier. Full text @ Cell