
FIGURE
Fig. 2
- ID
- ZDB-FIG-220801-223
- Publication
- Gurung et al., 2022 - Single-cell transcriptomic analysis of vascular endothelial cells in zebrafish embryos
- Other Figures
- All Figure Page
- Back to All Figure Page
Fig. 2
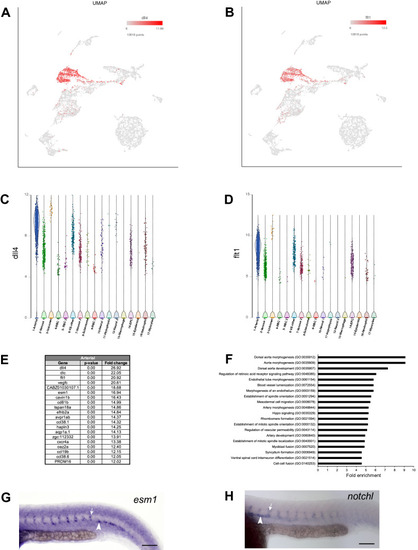
Arterial cluster #1. (A,B) UMAP feature plots showing expression of selected arterial top markers dll4 and flt1. (C,D) Violin plots showing expression of dll4 and flt1 in different cell populations. (E) List of top 20 marker genes differentially expressed in arterial cluster. (F) List of top 20 pathways enriched in arterial cluster. (G,H) In situ hybridization analysis at 24 hpf for selected marker genes esm1 and notchl. Note the expression of esm1 and notchl in the dorsal aorta (arrowhead) as well as the intersegmental vessels (arrow). Scale bars: 100 μm. |
Expression Data
| Genes: | |
|---|---|
| Fish: | |
| Anatomical Terms: | |
| Stage: | Prim-5 |
Expression Detail
Antibody Labeling
Phenotype Data
Phenotype Detail
Acknowledgments
This image is the copyrighted work of the attributed author or publisher, and
ZFIN has permission only to display this image to its users.
Additional permissions should be obtained from the applicable author or publisher of the image.
Full text @ Sci. Rep.