
Fig. 1
- ID
- ZDB-FIG-220801-222
- Publication
- Gurung et al., 2022 - Single-cell transcriptomic analysis of vascular endothelial cells in zebrafish embryos
- Other Figures
- All Figure Page
- Back to All Figure Page
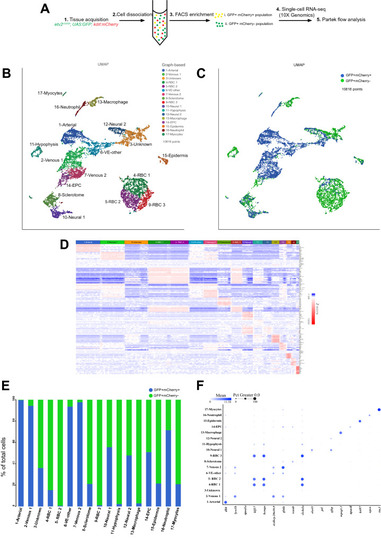
The scRNA-seq analysis of etv2ci32Gt; UAS:GFP; kdrl:mCherry embryos at the 24 hpf stage. (A) Schematics of the experimental design for scRNA-seq. (B) UMAP plot of 10,818 cells with 17 distinct clusters. Classifications were based on previously known marker genes which were significantly enriched in each cluster. RBC, red blood cells; VE, vascular endothelial; EPC, endothelial progenitor cells. (C) UMAP plot showing the distribution of GFP + mCherry + and GFP + mCherry- cells. (D) A heatmap showing expression of top marker genes in different clusters. Enlarged heatmap and gene list is shown in Fig. S1. (E) Fraction of GFP + mCherry + and GFP + mCherry- cells within each cluster. (F) A dot plot showing the expression of selected marker genes in different clusters. |