
Fig. 4
- ID
- ZDB-FIG-220801-225
- Publication
- Gurung et al., 2022 - Single-cell transcriptomic analysis of vascular endothelial cells in zebrafish embryos
- Other Figures
- All Figure Page
- Back to All Figure Page
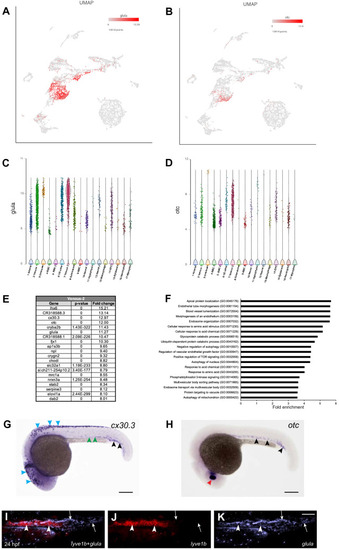
Venous-2 cluster #7. (A,B) UMAP feature plots showing expression of selected top markers for cluster #7, glula and otc. (C,D) Violin plots showing expression of glula and otc in different cell populations. (E) List of top 20 marker genes differentially expressed in Venous-2 cluster. (F) List of top 20 pathways enriched in Venous-2 cluster. (G) In situ hybridization analysis at 24 hpf for a previously uncharacterized marker gene cx30.3. Note the expression of cx30.3 in the caudal vein (black arrowheads) and weak expression in the PCV (green arrowheads). cx30.3 is also expressed in melanocytes (blue arrowheads). (H) In situ hybridization analysis at 24 hpf for a marker gene otc. Note the expression of otc in the CV, PCV (black arrowheads) and the lens (red arrowhead). Scale bars: 200 μm. (I–K) Two color fluorescent ISH analysis for the expression of lyve1b and glula at the 24 hpf stage. Note that many cells in the CV are positive for glula and not lyve1b (arrows), while cells with strong lyve1b expression in the PCV have only weak glula expression (arrowheads). Trunk and tail region is shown, anterior is to the left. PCV posterior cardinal vein, CV caudal vein. Scale bar in (K), 50 μm for (I–K). |
| Genes: | |
|---|---|
| Fish: | |
| Anatomical Terms: | |
| Stage: | Prim-5 |