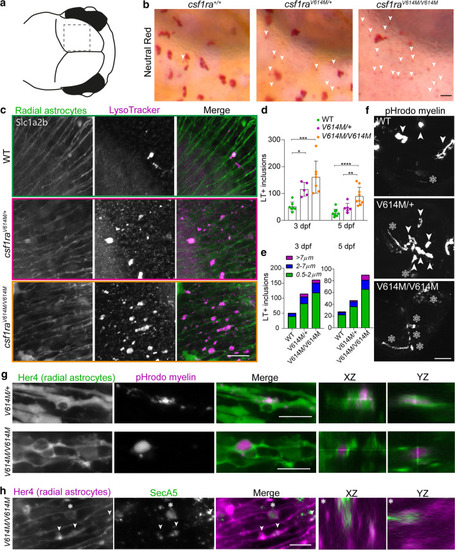
Astrocytic phenotype in heterozygous and homozygous missense zebrafish mutants indicates compensatory astrocytic endocytosis in early development. a Schematic image of the midbrain region imaged here. b Representative images of NR staining of half of the midbrain of csf1ra+/+, csf1raV614M/+ and csf1raV614M/V614M at 3 dpf. White arrows show small NR + dots in the region where astrocytes reside. c Representative images of LysoTracker staining (magenta) of csf1r WT, csf1raV614M/+ and csf1raV614M/V614M in a slc1a2b:Citrine background (green), visualizing radial astrocytes, in vivo at 3 dpf.d Quantifications of the number of LT + inclusions within radial astrocytes in the midbrain at 3 dpf in csf1rWT (n = 7, 9), csf1raV614M/+ (n = 5, 6) and csf1raV614M/V614M (n = 7, 9). e Quantifications of the number of LT + inclusions within radial astrocytes in the midbrain at 3 dpf (left) and 5 dpf (right), per category based on diameter of the inclusion (0.5–2 μm: green; 2–7 μm: blue; < 7 μm: purple). f Representative images of a maximum projection of a time-lapse video (3 h, 18–21 hpi), showing engulfment of pHrodo-labeled myelin by microglia (white arrows) and by radial astrocytes (white asterisks). g Representative images of pHrodo-labeled myelin inclusions (magenta) within radial astrocytes (green) in the midbrain of csf1raV614M/+ and csf1raV614M/V614M larvae at 4 dpf, 18 h post-injection (hpi). h Representative images of apoptotic cell particle (SecA5-mVenus + , green) inclusions within radial astrocytes (magenta) in the midbrain of csf1raV614M/V614M larvae at 3 dpf. One-way ANOVA or two-way ANOVA test was preformed to test for significance (p < 0.05). Error bars represent SD. *p < 0.05, **p < 0.01 ***p < 0.001. Scale bars equal 15 μm (b, c), 50 μm (f), 10 μm (g, h)
|
