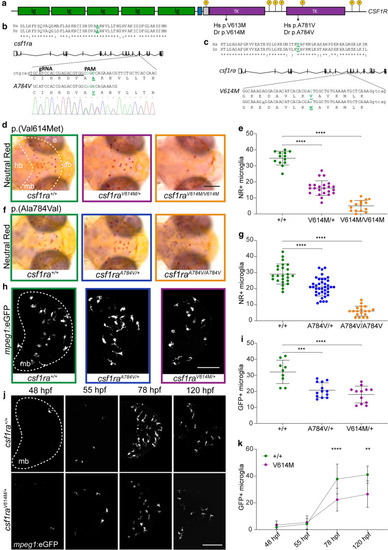
Heterozygous pathogenic missense variants in csf1ra result in microglial depletion in early development. a Schematic representation of the CSF1R gene, with five transmembrane immunoglobulin (ig) domains and two intracellular tyrosine kinase domains (TKD). Locations of the missense variants (human (Hs) and zebrafish (Dr)) are depicted, as well as tyrosine phosphorylation sites (p). b Schematic representation of csf1ra with: the location of the Ala784Val missense variant, located in exon 17 in the second TKD, the 19 bp gRNA, the PAM motif and the co-injected 30 bp oligo containing the missense variant, resulting in an Ala to Val change. c Schematic representation of csf1ra and the Val614Met missense variant in exon 13 [87]. d Representative images of the midbrain (mb, dashed line) after NR staining of csf1ra+/+ (green), csf1raV614M/+ (purple) and csf1raV614M/V614M (orange) larvae at 3 dpf. e Quantification of NR + microglia in csf1ra+/+ (green, n = 13), csf1raV614M/+ (purple, n = 23) and csf1raV614M/V614M (orange, n = 16) larvae at 3 dpf in the midbrain. f Representative images of the midbrain after NR staining of csf1ra+/+ (green), csf1raA784V/+ (blue) and csf1raA784V/A784V (orange) larvae at 3 dpf. g Quantification of NR + microglia in csf1ra+/+ (green, n = 24), csf1raA784V/+ (blue, n = 39) and csf1raA784V/A784V (orange, n = 19) larvae at 3 dpf. h Representative images of mpeg1:GFP + microglia in the midbrain (dashed line, mb) of csf1ra+/+ (green), csf1raA784V/+ (blue) and csf1raV614M/+ (purple) larvae at 3 dpf. i Quantification of mpeg1:GFP + microglia in csf1ra+/+ (green, n = 9), csf1raA784V/+ (blue, n = 13) and csf1raV614M/+ (purple, n = 12) at 3 dpf. j Representative longitudinal images of mpeg1:GFP + microglia in the midbrain (dashed line, mb) of the same csf1ra+/+ and csf1raV614M/+ larvae from 48 to 120 hpf. k Quantification of mpeg1:GFP + microglia in the midbrain of csf1ra+/+ (n = 6) and csf1raV614M/+ (n = 9) larvae from 48 to 120 hpf. Days-post-fertilization (dpf), eye (e), forebrain (fb), hindbrain (hb), midbrain (mb), neutral red (NR). One-way or two-way ANOVA test was preformed to test for significance (p < 0.05). Error bars represent SD. *p < 0.05, **p < 0.01, ***p < 0.001 ****p < 0.0001. Scale bar equals 100 μm (h, j) and 200 μm (d)
|
