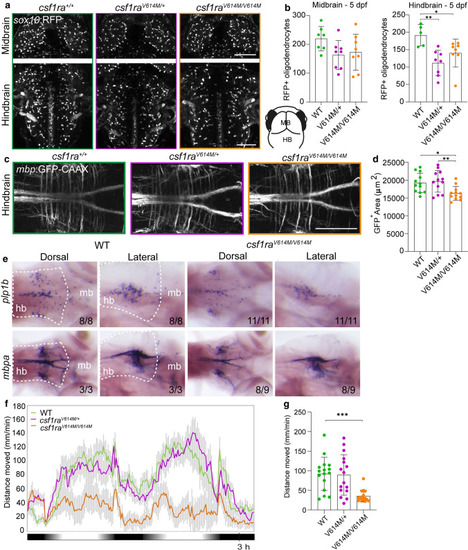
Homozygous missense variants in csf1ra causes myelin and behavioral abnormalities related to leukodystrophy. a Representative images of the midbrain (top) and the hindbrain (bottom) of csf1ra+/+ (green), csf1raV614M/+ (purple) and csf1raV614M/V614M (orange) larvae in a sox10:RFP background, visualizing oligodendrocytes, at 5 dpf. Lower right: schematic of zebrafish embryonic midbrain (mb) and hindbrain (hb). b Quantification of the number of sox10:RFP + oligodendrocytes in the midbrain and hindbrain at 5 dpf in WT (green), csf1raV614M/+ (purple) and csf1raV614M/V614M (orange) larvae. c Representative images of the hindbrain of WT (green), csf1raV614M/+ (purple) and csf1raV614M/V614M (orange) larvae in a mbp:GFP-CAAX background, visualizing myelin sheaths, at 5 dpf. d Quantification of the total mbp:GFP + myelinated area (μm2) in the hindbrain at 5 dpf in WT (green), csf1raV614M/+ (purple) and csf1raV614M/V614M (orange) larvae. e Representative images of in situ hybridization of plp1b (top) and mbpa (bottom) in WT (left) and csf1raV614M/V614M (right) larvae at 5 dpf, showing reduce number of plp1b + mature myelinating oligodendrocytes (11/11 larvae) and reduced mbpa + myelin sheaths and myelinating oligodendrocytes (8/9 larvae) in csf1raV614M/V614M larvae. Dashed lines show the hindbrain (hb). f Representative graph showing the total distance traveled (mm) by larvae per 1 min during the dusk–dawn routine (total time: 3 h 15 min), of csf1ra mutants in a csf1rb-deficient background. Grey shading shows the standard error of the mean (SEM). g Quantification of the total distance moved throughout the experiment excluding the dark period. n = 16 larvae per genotype. Days-post-fertilization (dpf), hindbrain (hb), midbrain (mb). One-way ANOVA test was preformed to test for significance (p < 0.05). Error bars represent SD, unless stated otherwise. *p < 0.05, **p < 0.01 ***p < 0.001. Scale bars equal 100 μm
|
