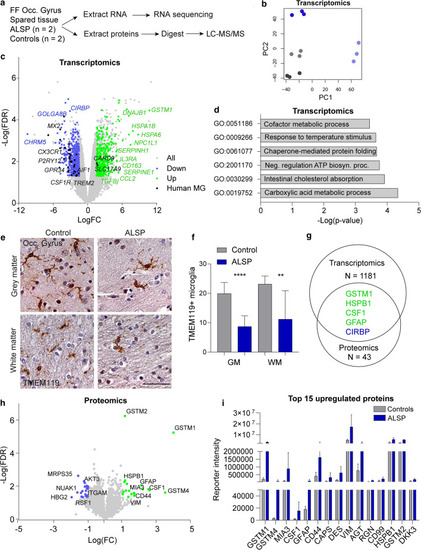
Transcriptomic and proteomic analysis of least-affected tissue of ALSP patients and controls. a Schematic representation of the experimental design. Fresh–frozen (FF) post-mortem brain tissue of the occipital gyrus was used to extract RNA and proteins. N = 2/group. b PCA plot of transcriptomics of the control (grey, n = 2) and ALSP tissue (blue, n = 2). c Volcano plot showing all genes picked up by bulk RNA sequencing (grey), and DEG (n = 1181) (downregulated: blue; upregulated: green). Black dots represent human microglia (MG) genes found differentially expressed in ALSP tissue [38]. DEG: FDR < 0.05, − 1.5 < LogFC > 1.5. d Representative graph of GO pathway analysis of the DEG. e Representative TMEM119 IHC images of the tissue (occipital gyrus) of controls (n = 2) and late-stage ALSP patients (n = 2) in grey matter (top row) and white matter (bottom row). f Quantification of TMEM119 + microglia in grey (left) and white matter (right) of occipital gyrus, count based on five images/individual. g Venn diagram showing the number of genes and proteins found to be differentially expressed in transcriptomics (n = 1181) and proteomics (n = 43), and the overlapping genes found in both data sets (n = 5). Green: upregulated, blue: downregulated. h Volcano plot showing all proteins detected by LC–MS/MS (grey) and differentially expressed proteins (n = 43) (downregulated: blue; upregulated: green). Differentially expressed proteins: FDR < 0.05, − 1 < LogFC > 1. i Representative graph of the normalized reporter intensity of the top 15 most upregulated proteins in ALSP (blue) and control tissue (grey). False-discovery rate (FDR), fold change (FC), grey matter (GM), occipital gyrus (Occ. gyrus), white matter (WM). Brown–Forsythe ANOVA with Dunnett’s multiple comparison test was performed to test for significance in the microglia count analysis (p < 0.05). **p < 0.01 ****p < 0.0001. Error bars represent SD. Scale bars equal 50 μm
|
