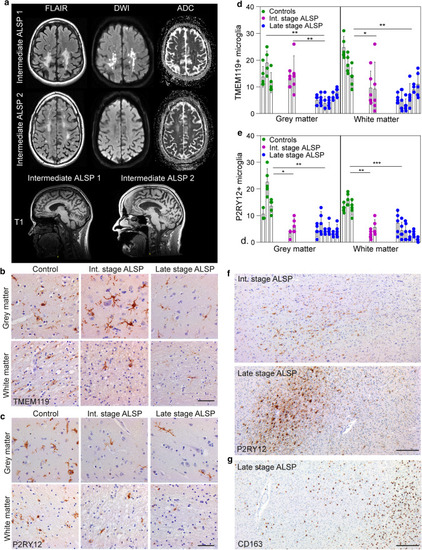
ALSP patients show an overall loss of (homeostatic) microglia and altered microglial distribution. a Brain MRI abnormalities in intermediate-stage ALSP patient 1 and intermediate-stage ALSP patient 2. Axial FLAIR images show hyperintense white matter abnormalities, most pronounced in the bilateral parietal and occipital lobes of intermediate-stage ALSP patient 1 and in the bilateral parietal and frontal lobes of intermediate-stage ALSP patient. Hyperintense signals on diffusion-weighted imaging (DWI) and corresponding low signal on apparent diffusion coefficient (ADC)-maps indicate restricted diffusion in the majority of the lesions in patient 1, but not in patient 2. Sagittal T1-weighted images show corpus callosum involvement and mild generalized brain atrophy in both patients. b Representative TMEM119 IHC images of the frontal gyrus of controls (n = 3), intermediate-stage ALSP patients (n = 2) and late-stage ALSP patients (n = 6) in grey matter (top row) and white matter (bottom row). c Representative P2RY12 IHC images of the frontal gyrus of controls (n = 3), intermediate-stage ALSP patients (n = 2) and late-stage ALSP patients (n = 6) in grey (top row) and white matter (bottom row). d, e Quantification of TMEM119 + (d) and P2RY12 + (e) microglia in grey (left) and white matter (right) of frontal gyrus. Data points represent microglia in one randomly taken image, 5 images/individual. f Representative P2RY12 IHC images of the frontal gyrus showing clustered distribution of P2RY12 + microglia in the white matter. g Representative CD163 IHC images of the frontal gyrus of late-stage ALSP (n = 6) patients showing clustered distribution of CD163 + cells in the white matter. Int.: intermediate. A nested one-way ANOVA test was preformed to test for significance (p < 0.05). Error bars represent SD. *p < 0.05, **p < 0.01, ***p < 0.001. Scale bars equal 50 μm (b, c) and 500 μm (f, g)
|
