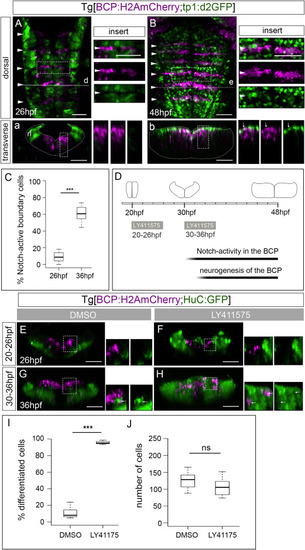
Figure 4. Boundary cells undergo a switch in Notch-activity (A and B) Tg[BCP:H2AmCherry;tp1:d2GFP] embryos at indicated stages in dorsal view; inserts display single-stack magnifications of framed regions in (A)–(B) with single or overlayed channels. (a and b) Transverse views of the indicated boundary (dashed line). Note that by 48 hpf boundary cells are Notch active (white arrows in inserts). (C) Boxplot showing the switch of Notch-activity in the boundary cells (9.06% at 26 hpf [SD 5.41, SEM 1.21; N = 20 boundaries; n = 5 embryos, 4 boundaries per embryo] to 60.6% at 36 hpf [SD 8.69, SEM 2.7; N = 16 boundaries; n = 4 embryos, 4 boundaries per embryo]; p value t test p < 0.001 [∗∗∗]). (D) Experimental design for loss of Notch function experiments, depicting the hindbrain shape and the treatments with the Notch inhibitor LY411575. (E–H) Transverse views of Tg[BCP:H2AmCherry;HuC:GFP] embryos treated for 6 h at 20 hpf (E–F; DMSO n = 3/3 embryos; LY411575 n = 4/4 embryos) and at 30 hpf (G–H; DMSO n = 4/4 embryos; LY411575 n = 4/4 embryos). Note the increase in the HuC-positive boundary cells (white arrows) when the treatment was after the onset of Notch-activity (H). Scale bar, 50 μm. All inserts display single z stack magnification with single or overlayed channels. (I and J) Boxplots displaying the percentage of differentiated boundary cells (10.81% in DMSO [SD 6.73%, SEM 2.38%] versus 95.63% in LY411575 [SD 1.91%, SEM 0.67%]; p value t test p < 0.001 [∗∗∗]) and the total number of boundary cells (average number per boundary 126 cells in DMSO [SD 25.27, SEM 8.93] versus 106.25 cells in LY411575 [SD 26.30, SEM 9.30]; p value t test p = 0.14 [ns]) at 36 hpf, after DMSO and LY411575 treatment (30–36 hpf).
|
