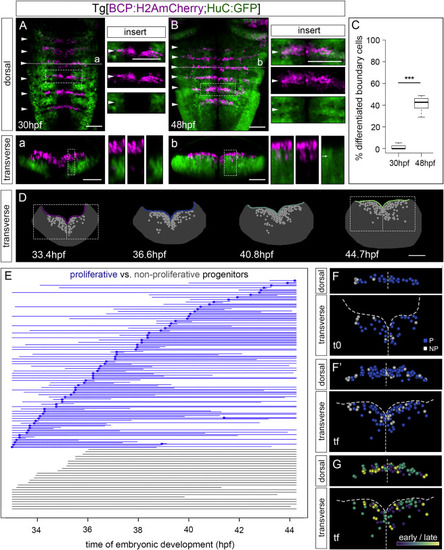
Figure 2. Boundary cells undergo neuronal differentiation in a time-dependent manner (A and B) Tg[BCP:H2AmCherry;HuC:GFP] embryos at indicated stages as dorsal MIP with anterior to the top; inserts display single-stack magnifications of the framed regions, with single or overlayed channels. (a and b) Transverse views of (A)–(B) as MIP of the indicated boundary (dashed line). Note that by 48 hpf boundary cells are in the neuronal differentiated domain (see white arrow in insert). White arrowheads in (A)–(B) indicate the position of the hindbrain boundaries. (C) Boxplot showing the increase of differentiated boundary cells (30 hpf [1.14% cells, SD 1.71, SEM 0.38] versus 48 hpf [41.6% cells, SD 5.80, SEM 1.30]; p value t test ∗∗∗p < 0.001). N = 20 boundaries; n = 5 embryos, 4 boundaries per embryo. (D) Spatiotemporal map of the boundary growth showing the position of all cells at the indicated time; annotated boundary cell nuclei (gray dots) displayed on the top of neural tube masks (gray surfaces) and corresponding segmented ventricular surfaces color-coded according to developmental time (33.4 hpf, purple; 36.6 hpf, blue; 40.8 hpf, turquoise; 44.7 hpf, light green); transverse view. (E) Flat representation of the lineage tree of boundary cells color-coded according to the proliferative behavior (blue, dividing; gray, non-dividing) and organized by time of cell division within each category. Each line corresponds to a single cell from the moment of tracking onward, which bifurcates upon cell division. Interrupted lines indicate that cells were lost from the field. X axis, time of embryonic development. (F–F′) Spatial map of a single boundary displaying the regions framed in (D), with annotated boundary cells’ nuclei from (E) as dots in the same color code. t0 = 33.4 hpf (F), tf = 44.7 hpf (F′). (G) Spatial map of a single boundary at tf displaying the region framed in (D), with annotated cell nuclei from progenitors color-coded according to time of division (33.4–36.6 hpf, purple; 36.6–40.8 hpf, turquoise; 40.8–44.7 hpf, yellow). Maps were built after following the lineages of all boundary cells during this time interval, displayed in dorsal (top) or transverse (bottom) views. Analyses in (D)–(G) were performed in ID111219A embryo and backed up with partial analyses of other embryos (Tables S1 and S2 and Figure S3G). BCP, boundary cell population; hpf, hours post-fertilization. Scale bar, 50 μm.
|
