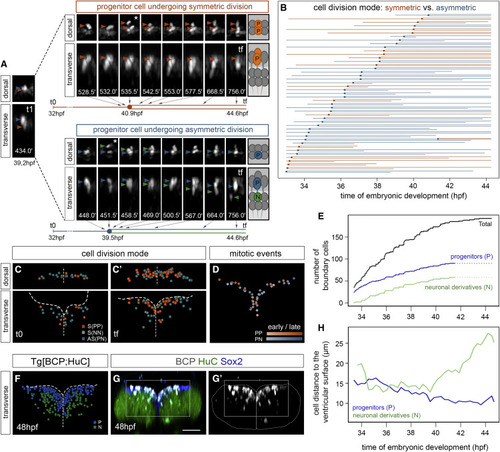
Figure 3. Proliferative boundary progenitor cells undergo both symmetric and asymmetric division (A) Time-lapse stills of a Tg[BCP:H2AmCherry;CAAX:GFP] embryo showing two neighboring progenitor cells undergoing distinct division modes (dorsal and transverse views) color-coded as symmetrical proliferative divisions (PP; orange) and asymmetric divisions (PN; progenitor, blue; neuron, green). White asterisks indicate the corresponding dividing cell. Numbers at the bottom of the transverse stills correspond to the reciprocal minutes of the movie (e.g., t1 = 434.0 min corresponds to a still 7.2 h after the beginning of the movie, 39.2 hpf; tf = 756.0 min corresponds to 12.6 h after, thus 44.6 hpf). The flat lineage diagram depicted underneath each example displays the timeline with the correspondence to the stills. (B) Flat representation of the proliferative boundary cell lineage tree, color-coded according to mode of division (orange, symmetric; blue, asymmetric) and organized by time of division. Each line corresponds to a single cell from the moment of tracking onward that bifurcates upon cell division. X axis displays the time of embryonic development. We did not consider for fate ascription cells tracked for less than 3 h after division if the position of both daughter cells was not clear. An interrupted line means that the cell was lost from the field. (C–C′) Spatial map of a single boundary at t0 = 33.4 hpf (C) and tf = 44.7 hpf (C′) with all annotated nuclei from boundary progenitors shown in (B) color-coded as symmetric proliferative division (orange), asymmetric division (green), and symmetric neurogenic division (gray). Note that only two symmetric neurogenic divisions were found later than 40 hpf (NN, gray cells at tf). (D) Spatial map of a single boundary in transverse view showing the region framed in (G), with the overlay of mitotic events over time (see hues indicating time, early versus late) and color-coded according to cell division mode. Maps were built after following the lineages of all cells of the boundary during this time interval. (E) Graph with the total number of tracked boundary cells (black line), both proliferating and non-proliferating, the boundary progenitors arising from cell division (blue line), and the differentiated neurons derived from asymmetric division (green line), at each time point. Since cell fate could not always be ascribed with enough confidence when cells were tracked for less than 3 h after division, the complete data in the last 3 h of the lineage could not be obtained (see dashed lines from 41.5 hpf onward). (F) Spatial map of a boundary of Tg[BCP:H2AmCherry; HuC:GFP] embryo displaying the ventricular region framed in (G) at tf, with annotated nuclei color-coded according to the final fate (progenitor, blue; neuron, green). Note boundary cells populate the neuronal differentiation domain. (G–G′) Tg[BCP:H2AmCherry] embryos immunostained with Sox2 and HuC at 48 hpf. Scale bar, 50 μm. (H) Graph displaying the average distance to the ventricular surface (0 μm, close, versus 30 μm, far) of the two boundary cell derivatives over time. Note progenitor cells (blue line) become closer to the surface, whereas neuronal derivatives (green line) move away. Analyses in (A)–(E) were performed in ID111219A embryo, with partial analyses of other embryos (Tables S1 and S2). ID111219A and ID260310B were used in (F), and ID111219A and ID111219C were used in (H).
|
