
Fig. 2
- ID
- ZDB-FIG-220623-38
- Publication
- Georgantzoglou et al., 2022 - A two-step search and run response to gradients shapes leukocyte navigation in vivo
- Other Figures
- All Figure Page
- Back to All Figure Page
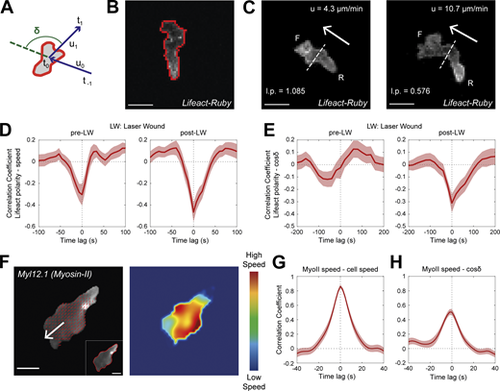
Rear Lifeact distribution reports phases of fast motion and fast actin flows. (A) Scheme of a neutrophil, indicating the definition of angle δ, between the velocity vectors (u) between three successive timepoints (t−1, t0, t1). (B) Outline (red line) of an example of segmented neutrophil within a Tg(mpx:Lifeact-Ruby) transgenic larva. Scale bar = 10 μm. (C) Examples of neutrophil Lifeact distribution with an indication of cell speed (u) and Lifeact polarity (l.p.) at the same timepoint, for laser wounding. Arrows indicate the direction of motion. Dashed lines indicate the automated separation of the front (F) and rear (R) part of cell. Scale bar = 10 μm. (D and E) Temporal cross-correlation between Lifeact polarity and speed (D) or between Lifeact polarity and cosine of δ (E), pre- (left) and post-LW (right). Average from n = 21 migrating cells, from 9 larvae. Mean and SEM are shown. (F) Left: Representative neutrophil within a Tg(actb1:myl12.1-eGFP) transgenic larva migrating towards a mechanical wound; white arrow indicates the vector of speed; red arrows indicate the velocity vector fields of Myosin-II retrograde flow; inset (bottom right) indicates the segmented outline of the neutrophil. Scale bar = 5 μm. Right: Heatmap of the speed of the Myosin-II retrograde flow. Color bar indicates low- and high-speed values. (G) Temporal cross-correlation between Myosin-II retrograde flow speed and neutrophil speed. (H) Temporal cross-correlation between Myosin-II retrograde flow speed and neutrophil cosine of δ. (G and H) n = 25 cells, from 6 larvae. Mean and SEM are shown. |