
Fig. 7
- ID
- ZDB-FIG-220615-47
- Publication
- Cosacak et al., 2022 - Single Cell/Nucleus Transcriptomics Comparison in Zebrafish and Humans Reveals Common and Distinct Molecular Responses to Alzheimer's Disease
- Other Figures
- All Figure Page
- Back to All Figure Page
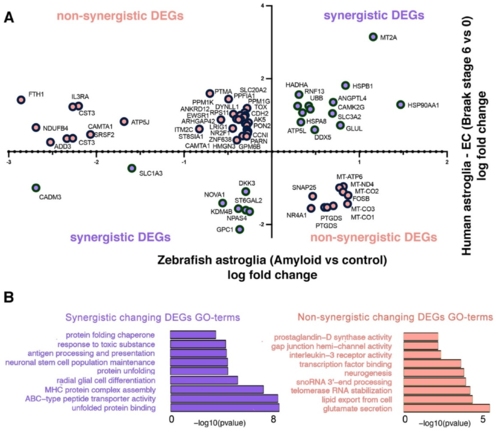
Figure 7. Comparison of differentially expressed genes in the human and zebrafish astroglia clusters. (A) Chart indicating the genes that are differentially expressed in astroglial clusters 2 and 4 in zebrafish (telencephalon, amyloid toxicity versus control) and human brains (entorhinal cortex, Braak stage 6 versus 0) when these clusters are compared within. The x-axis shows the log-fold changes for zebrafish astroglia and the y-axis denotes the log-fold changes in human astroglia. Duplicate gene names indicate their appearance in both astroglial clusters. The gene names are distributed sterically on the graph. (B) Selected GO terms for synergistically and non-synergistically differentially expressed genes in all astroglial clusters, combined. See Datas S4, S5 and S12. |