
Fig. 6
- ID
- ZDB-FIG-220615-46
- Publication
- Cosacak et al., 2022 - Single Cell/Nucleus Transcriptomics Comparison in Zebrafish and Humans Reveals Common and Distinct Molecular Responses to Alzheimer's Disease
- Other Figures
- All Figure Page
- Back to All Figure Page
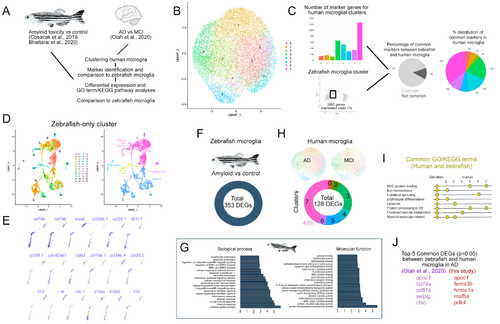
Figure 6. Comparison of human and zebrafish microglia. (A) Schematic representation of the analysis pipeline. Open access datasets from [38,40,41] (B) Clustering of the human microglia single cell sequencing data. (C) Comparison of the number of marker genes in microglial clusters, pie charts for the percentage of common marker genes of zebrafish microglia and human microglia, and the distribution of the common genes to individual human microglial clusters. (D) Clustering of zebrafish single cell sequencing dataset, both alone and color-coded tSNE plots for cell types. (E) Zebrafish immune cell clusters and representative gene expressions. (F) Differentially expressed gene analyses in zebrafish microglia and human microglia in AD. (G) Representative graphs of the biological process and molecular functions of the differentially expressed genes in zebrafish microglia in the AD model. (H) Clustering of human microglia dataset [38] from Alzheimer’s disease versus Mild cognitive impairment patients and differentially expressed gene numbers. (I) Representative GO terms and KEGG pathways that are common in human and zebrafish microglia. (J) Comparison of the top five common differentially expressed genes in zebrafish [40,41] and human microglia [38] in AD. See Datas S6–S11. |