
Fig. 3
- ID
- ZDB-FIG-220615-43
- Publication
- Cosacak et al., 2022 - Single Cell/Nucleus Transcriptomics Comparison in Zebrafish and Humans Reveals Common and Distinct Molecular Responses to Alzheimer's Disease
- Other Figures
- All Figure Page
- Back to All Figure Page
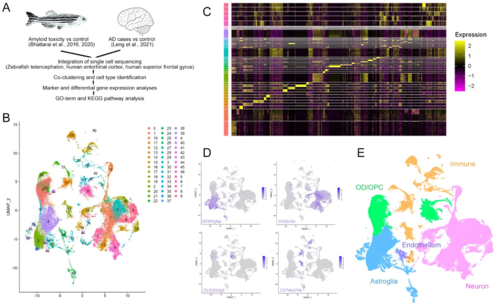
Figure 3. Integration of single cell transcriptomics data from zebrafish and human brains in AD. (A) Schematic work pipeline for integration of open-access datasets from [29,37,40,41,42,43,44,45,46,47,48,49]. (B) tSNE plot that co-localizes and clusters human and zebrafish cells. (C) Heat map of the marker genes of the identified clusters. (D) Exemplary gene expression for cell clusters: GFAP for astroglia, SV2 for neurons, OLIG2 for oligodendrocytes, and CD74 for immune cells. (E) Colored cell type identification tSNE for human and zebrafish composite single cell clustering. See Figures S1 and S2 and Data S1. |