
Fig. 4
- ID
- ZDB-FIG-220615-44
- Publication
- Cosacak et al., 2022 - Single Cell/Nucleus Transcriptomics Comparison in Zebrafish and Humans Reveals Common and Distinct Molecular Responses to Alzheimer's Disease
- Other Figures
- All Figure Page
- Back to All Figure Page
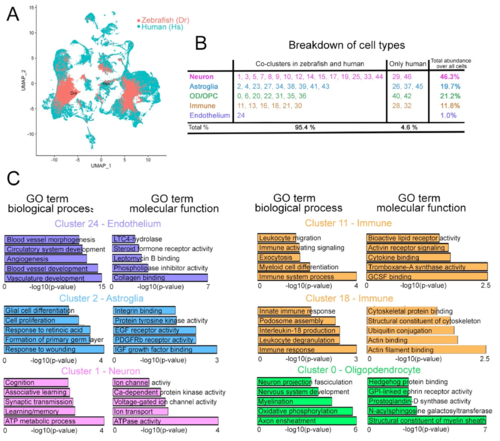
Figure 4. Analyses of the composite human–zebrafish single cell clusters. (A) Color-coded breakdown of the cells on the composite tSNE plot. Green: human cells; red: zebrafish cells. (B) Table showing the cluster numbers, identities, their co-clustering status in human and zebrafish, and the abundance of cells in those clusters. 95.4% of all cells on the composite tSNE plot can be co-clustered in humans and zebrafish. 4.6% of all cells are only in human clusters. (C) GO term enrichment graphs for the representative endothelial, neuronal, astroglial, immune, and neuronal clusters. See Figures S3 and S4, Datas S2 and S3. |