FIGURE
            Figure 5—figure supplement 3.
- ID
 - ZDB-FIG-220426-50
 - Publication
 - Cornean et al., 2022 - Precise in vivo functional analysis of DNA variants with base editing using ACEofBASEs target prediction
 - Other Figures
 - 


- Figure 1
 - Figure 1—figure supplement 1.
 - Figure 1—figure supplement 2.
 - Figure 1—figure supplement 3.
 - Figure 2
 - Figure 2—figure supplement 1.
 - Figure 2—figure supplement 2.
 - Figure 3
 - Figure 3—figure supplement 1.
 - Figure 3—figure supplement 2.
 - Figure 4
 - Figure 4—figure supplement 1.
 - Figure 5
 - Figure 5—figure supplement 1.
 - Figure 5—figure supplement 2.
 - Figure 5—figure supplement 3.
 - Figure 6
 - Figure 6—figure supplement 1.
 - Figure 6—figure supplement 2.
 - Figure 6—figure supplement 3.
 - Figure 6—figure supplement 4.
 - Figure 6—figure supplement 5.
 - Figure 7
 - Figure 7—figure supplement 1.
 - Figure 7—figure supplement 2.
 - Figure 7—figure supplement 3.
 - Figure 7—figure supplement 4.
 - Figure 7—figure supplement 5.
 - Figure 7—figure supplement 6.
 - Figure 7—figure supplement 7.
 - Figure 8.
 
 - All Figure Page
 - Back to All Figure Page


                        Figure 5—figure supplement 3.


| 


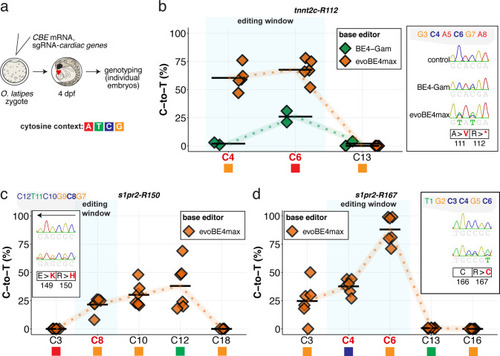
             Summary of C-to-T conversion efficiencies. Sample number used for evoBE4max: n = 5, 6, 6, respectively for (b–d); and BE4-Gam: n = 2 (b). To highlight the dinucleotide context, the nucleotide preceding the target C is shown by red (A), green (T), blue (C) and yellow (G) squares below the respective C. 
        
    
  | 


                        Expression Data


                        Expression Detail


                        Antibody Labeling


                        Phenotype Data


                        Phenotype Detail


                        Acknowledgments


This image is the copyrighted work of the attributed author or publisher, and
ZFIN has permission only to display this image to its users.
Additional permissions should be obtained from the applicable author or publisher of the image.
      Full text @ Elife