
Figure 4
- ID
- ZDB-FIG-220426-45
- Publication
- Cornean et al., 2022 - Precise in vivo functional analysis of DNA variants with base editing using ACEofBASEs target prediction
- Other Figures
-
- Figure 1
- Figure 1—figure supplement 1.
- Figure 1—figure supplement 2.
- Figure 1—figure supplement 3.
- Figure 2
- Figure 2—figure supplement 1.
- Figure 2—figure supplement 2.
- Figure 3
- Figure 3—figure supplement 1.
- Figure 3—figure supplement 2.
- Figure 4
- Figure 4—figure supplement 1.
- Figure 5
- Figure 5—figure supplement 1.
- Figure 5—figure supplement 2.
- Figure 5—figure supplement 3.
- Figure 6
- Figure 6—figure supplement 1.
- Figure 6—figure supplement 2.
- Figure 6—figure supplement 3.
- Figure 6—figure supplement 4.
- Figure 6—figure supplement 5.
- Figure 7
- Figure 7—figure supplement 1.
- Figure 7—figure supplement 2.
- Figure 7—figure supplement 3.
- Figure 7—figure supplement 4.
- Figure 7—figure supplement 5.
- Figure 7—figure supplement 6.
- Figure 7—figure supplement 7.
- Figure 8.
- All Figure Page
- Back to All Figure Page
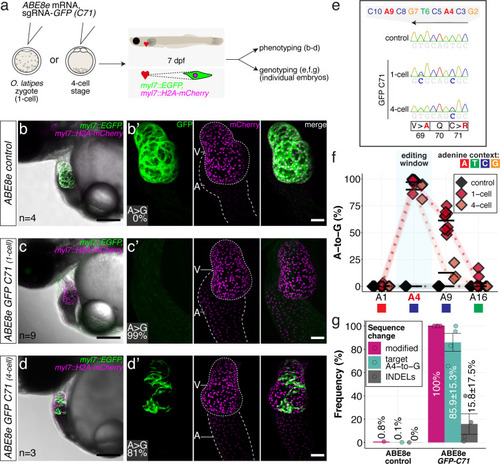
(a) Co-injection of ABE8e mRNA with GFP-C71 sgRNA into a single cell of one-cell or four-cell stage medaka embryos (myl7::EGFP, myl7::H2A-mCherry). Control injections with ABE8e mRNA. Scoring of fluorescence was performed at 7 dpf followed by genotyping of each individual embryo. Confocal microscopy of chemically arrested hearts (representative images) at 7 dpf (lateral view with V = ventricle, A = atrium). Overview images, overlaid with transmitted light, show maximum z-projections of optical slices acquired with a z-step size of 5 µm. Scale bar = 200 µm (b–d). Close-up images show maximum z-projections of optical slices acquired with a z-step size of 1 µm. Note the display of A-to-G conversion rates for A4 causing the p.C71R missense mutation (see g) and Supplementary file 2. Scale bar = 50 µm (b-d’). (e–f) Quantification of Sanger sequencing reads show close to homozygosity rates of A-to-G transversions installing the C71R missense mutation (Supplementary file 2). Note: sgRNA GFP-C71 targets the complementary strand (arrow in f). To highlight the dinucleotide context, the nucleotide preceding the target A is shown by red (A), green (T), blue (C) and yellow (G) squares below the respective A. dpf = days post fertilization. (g) Amplicon-seq of the target region a subset (n = 4) of 1 cell stage ABE8e experiment gDNA samples (single embryos) was used to quantify the outcome of intended base editing and indel formation. Aligned Illumina-reads analyzed, 14,653 (control); 23,201 (ABE8e rep1); 10,696 (ABE8e rep2); 66,311 (ABE8e rep3); 48,126 (ABE8e rep4).
|