
Figure 2
- ID
- ZDB-FIG-220426-39
- Publication
- Cornean et al., 2022 - Precise in vivo functional analysis of DNA variants with base editing using ACEofBASEs target prediction
- Other Figures
-
- Figure 1
- Figure 1—figure supplement 1.
- Figure 1—figure supplement 2.
- Figure 1—figure supplement 3.
- Figure 2
- Figure 2—figure supplement 1.
- Figure 2—figure supplement 2.
- Figure 3
- Figure 3—figure supplement 1.
- Figure 3—figure supplement 2.
- Figure 4
- Figure 4—figure supplement 1.
- Figure 5
- Figure 5—figure supplement 1.
- Figure 5—figure supplement 2.
- Figure 5—figure supplement 3.
- Figure 6
- Figure 6—figure supplement 1.
- Figure 6—figure supplement 2.
- Figure 6—figure supplement 3.
- Figure 6—figure supplement 4.
- Figure 6—figure supplement 5.
- Figure 7
- Figure 7—figure supplement 1.
- Figure 7—figure supplement 2.
- Figure 7—figure supplement 3.
- Figure 7—figure supplement 4.
- Figure 7—figure supplement 5.
- Figure 7—figure supplement 6.
- Figure 7—figure supplement 7.
- Figure 8.
- All Figure Page
- Back to All Figure Page
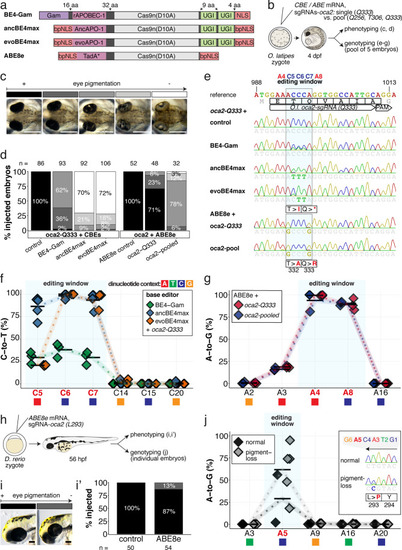
(a) Schematic diagram of the cytosine base editors BE4-Gam, ancBE4max and evoBE4max (evoAPOBEC1-BE4max) and the adenine base editor ABE8e. Cas9n-D10A nickase (light grey) with N-terminally linked cytidine or deoxyadenosine deaminase (pink) and C-terminal SV40 or bipartite (bp) nuclear localization sequence (NLS, red). All except BE4-Gam also contain the bpNLS N-terminally. CBEs contain variations of the rat APOBEC-1 cytidine deaminase, whereas ABE8e contains the TadA* domain (tRNA adenine deaminase), CBEs further contain C-terminally linked Uracil glycosylase inhibitors (UGI, green). Gam protein from bacteriophage Mu (purple) and linkers of varying lengths (dark grey). (b) Scheme of the experimental workflow. Cytosine or adenine base editor (CBE/ABE) mRNA and oca2-Q333 or a pool of three oca2-sgRNAs (–Q256, –T306, –Q333) were injected into the cell of a medaka zygote. Control injections only contained oca2-Q333 or ABE8e mRNA. (c) Phenotypic inspection of eye pigmentation was performed at 4 dpf (dorsal view). (d) Grouped and quantified pigmentation phenotypes shown for BE4-Gam, ancBE4max, evoBE4max, and ABE8e experiments. Control only contains oca2-Q333 sgRNA. n shown excludes embryos that are otherwise abnormal or dead, with abnormality rate given in supplement 1c. (e) Exemplary Sanger sequencing reads for each experimental condition, obtained from a pool of five randomly selected embryos at the oca2-Q333 locus. (f–g) Quantification of Sanger sequencing reads (by EditR, Kluesner et al., 2018) for BE4-Gam (n = 3), ancBE4max (n = 5) and evoBE4max (n = 3) (f), and ABE8e for single (n = 3) and pooled oca2-sgRNA experiments (n = 3) (g). Pools of five embryos per data point summarizes editing efficiencies. Mean data points are summarized in Supplementary files 1 and 2. To highlight the dinucleotide context, the nucleotide preceding the target C or A is shown by red (A), green (T), blue (C) and yellow (G) squares below the respective C or A. (h) Microinjections into the yolk of one-cell stage zebrafish were performed with ABE8e mRNA and oca2-L293 sgRNA. Zebrafish larvae were phenotypically analyzed at 56 hpf and individual larvae were subsequently genotyped. (i-i’) Larvae were scored as without (‘normal’, black) or with loss of eye pigment (grey). (j) Sanger sequencing on individually scored larvae was analyzed by EditR and plotted according to phenotype. Scale bars = 400 µm (c) or 100 µm (i). dpf / hpf = days/hours post fertilization.
|