
Fig. 7
- ID
- ZDB-FIG-220307-29
- Publication
- Marquez-Legorreta et al., 2022 - Brain-wide visual habituation networks in wild type and fmr1 zebrafish
- Other Figures
- All Figure Page
- Back to All Figure Page
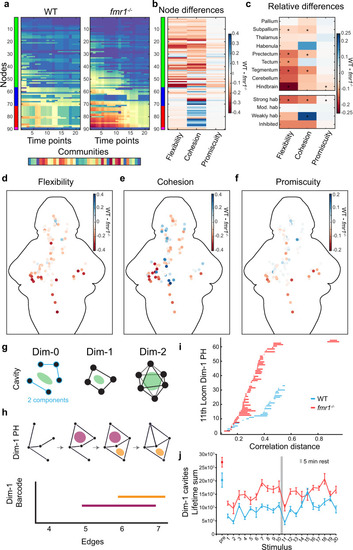
Dynamic community detection and persistent homology across WT and fmr1−/− graphs.
a Example community detection results obtained with γ = 1.6 and ω = 0.9. b Relative (WT minus fmr1−/−) values of flexibility, cohesion, and promiscuity for each of the nodes. c Relative values of flexibility, cohesion, and promiscuity for 9 brain regions and by functional cluster. The color represents the difference of the median (WT minus fmr1−/−) and * indicates statistical significance (p < 0.00384) for a Friedman’s test (one-sided) and Bonferroni correction. Details can be found in Supplementary Table 3. d–f Heat map of the relative (WT minus fmr1−/−) values of flexibility (d), cohesion (e), and promiscuity (f) for individual nodes across the brain. g Conceptual examples of structures that can be analyzed with the persistent homology method. h Schematic example of a persistent homology analysis. Persistent homology tracks cavities (pink and orange regions) across a sequence of networks in which edges are added according to their decreasing correlation strength (top), and the lifespans of these cavities can be represented as edges are added (bottom). i Example dimension 1 barcode graphs for fmr1 mutants and WT at the 11th loom. j Lifetime sums in dimension 1 of fmr1 mutants (red) and WT (blue) at pre-loom and 20 loom time points. Results for dimensions 0 and 2 are shown in Supplementary Fig. 11a–e. Centre represents the mean and error bars indicate 95% CIs. |