
Fig. 5
- ID
- ZDB-FIG-220307-27
- Publication
- Marquez-Legorreta et al., 2022 - Brain-wide visual habituation networks in wild type and fmr1 zebrafish
- Other Figures
- All Figure Page
- Back to All Figure Page
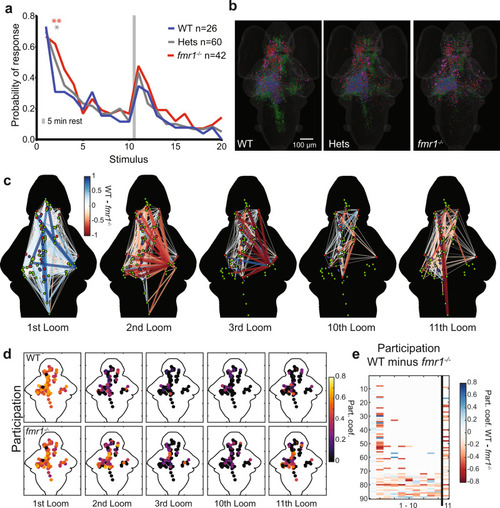
Behavioral and network-wide changes in fmr1−/− larvae.
a Probability of response across the three groups to two blocks of ten looms. Over the course of two blocks of 10 stimuli, fmr1−/− larvae show slower habituation and stronger recovery than WT siblings, and heterozygotes show an intermediate phenotype. One-sided binomial test: fmr1−/− versus WT: 2nd Loom (p = 3.056e−5); 3rd Loom (p = 0.034); 11th Loom (p = 0.055); 16th Loom (p = 0.039). Heterozygotes versus WT: 2nd Loom (p = 0.001) and 9th Loom (p = 0.039). All other comparisons (p > 0.1). Significance cutoffs using a Bonferroni correction are *p < 0.00125 and **p < 0.00025, equivalent to uncorrected p < 0.05 and 0.01, respectively. b Brain-wide distributions of ROIs for the three genotypes, color-coded for functional cluster as in Figs. 2 and 3a. A random sample (n = 11) of Hets was selected to match WT (n = 10) and fmr1−/− (n = 11). c Node-based graphs showing relative correlations (WT correlation minus fmr1−/− correlation), where blue indicates correlations that are stronger in WT and red indicates correlations that are stronger in fmr1−/−. Larvae imaged to generate the graphs for WT = 10 and fmr1−/− = 11. d Heat maps of participation for all nodes across habituation and recovery. e A raster plot of relative participation (WT participation minus fmr1−/− participation) for each node through the first 11 trials. |