
FIGURE
Fig. 3
- ID
- ZDB-FIG-220307-25
- Publication
- Marquez-Legorreta et al., 2022 - Brain-wide visual habituation networks in wild type and fmr1 zebrafish
- Other Figures
- All Figure Page
- Back to All Figure Page
Fig. 3
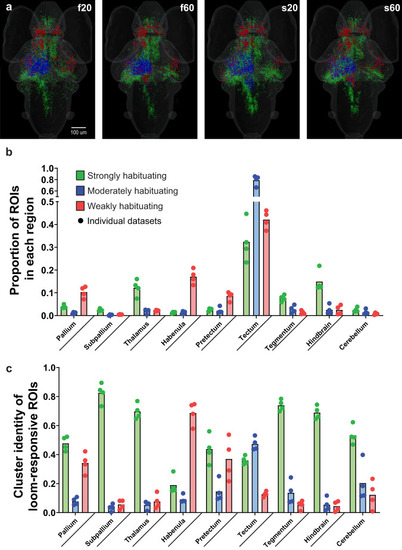
Brain-wide responses during different loom stimulus trains.
a Brain-wide distributions of the functional clusters from Fig. 2 for each of four loom habituation paradigms. b Averaged proportions of ROIs in the four data sets, from the brain’s total number of each functional cluster, located in the indicated brain regions. c Averaged proportion of each cluster’s representation among the loom-responsive ROIs in each brain region. The individual paradigms (f20, f60, s20, and s60) are represented as circles, n = 4 paradigms. Statistical analysis of these proportions is detailed in Supplementary Tables 1 and 2. |
Expression Data
Expression Detail
Antibody Labeling
Phenotype Data
Phenotype Detail
Acknowledgments
This image is the copyrighted work of the attributed author or publisher, and
ZFIN has permission only to display this image to its users.
Additional permissions should be obtained from the applicable author or publisher of the image.
Full text @ Nat. Commun.