
Fig. 1
- ID
- ZDB-FIG-220307-23
- Publication
- Marquez-Legorreta et al., 2022 - Brain-wide visual habituation networks in wild type and fmr1 zebrafish
- Other Figures
- All Figure Page
- Back to All Figure Page
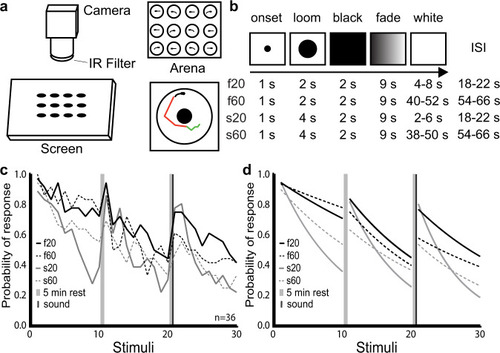
Modulation of habituation by stimulus features.
a Schematic representation of our setup for measuring visual habituation behavior. A 12-well chamber with one larva in each well (top right) was filmed on a horizontal screen (left) on which the looms were presented. Automated tracking recorded periods of swim bouts (green) and burst swim (red) for each larva (bottom right). b Stimulus train properties across the 4 experimental groups. In all cases, the stimulus appeared for 1 s before expanding over a 2-s (fast) or 4-s (slow) period. The resulting black screen was maintained for 2 s before fading to white over a 9 s period, followed by a variable period of white screen prior to the next stimulus period. The average ISI for each type of stimulus is shown in the right column: 20 s for f20 and s20, and 60 s for f60 and s60. ISIs were varied slightly to prevent the timed prediction of consecutive stimuli. c Probability of response across the 4 groups during three blocks of ten loom presentations. Probability was calculated at each loom presentation as: number of responding fish divided by total number of fish (n = 36). d Fitted exponential one-phase decay curves of the response probability for each group. The consistency of these results across different clutches of larvae is presented in Supplementary Fig. 1. |