
FIGURE 7
- ID
- ZDB-FIG-220220-29
- Publication
- Hammer et al., 2022 - Visual Function is Gradually Restored During Retina Regeneration in Adult Zebrafish
- Other Figures
- All Figure Page
- Back to All Figure Page
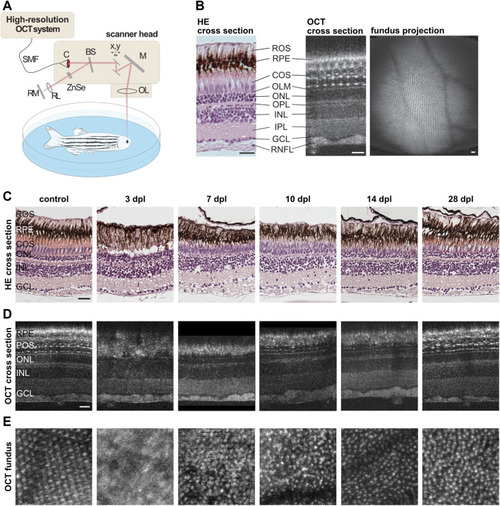
Retinal morphology is restored gradually after light lesion. (A) Scheme of the custom-built high resolution optical coherence tomography (OCT) setup. Laser light is guided to the scanner head via a single-mode fiber (SMF) and transferred into a free beam by a collimator (C). The incoming light is separated into a reference beam and a sample beam by a beamsplitter (BS). The sample light is deflected by two galvanometer scanners (x,y) to achieve a 2D scan pattern over the sample, reflected by a mirror (M) and focused by an adjustable focus lens (OL) into the eye where it is scattered and reflected back. The reference beam is guided through a zinc selenide glass (ZnSe) and focused by a lens (RL) before being reflected by a mirror (RM). Both beams are superimposed by the beamsplitter, spectrally resolved measured by a line scan sensor. (B) Comparison of a retinal cross section stained with hematoxylin/eosin (HE) and a cross section obtained via OCT imaging revealed a high degree of similarity. With the exception of the rod outer segments (ROS) which can be recognized only in HE stained samples at the top, all subsequent layers including the retinal pigment epithelium (RPE), the cone outer segments (COS), the outer limiting membrane (OLM), the outer nuclear layer (ONL), the outer plexiform layer (OPL), the inner nuclear layer (INL), the inner plexiform layer (IPL), the ganglion cell layer (GCL) and the retinal nerve fiber layer (RNFL) can be seen in both, HE and OCT. In addition, small hyper-reflective structures were observed in the photoreceptor layer imaged with OCT that mark the intersection between cone inner and outer segments. A fundus projection calculated from the OCT data showed the cone mosaic pattern as well as the retinal blood vessels in the central part of the retina. (C) HE stainings of unlesioned control samples as well as specimen fixed at 3, 7, 10, 14, and 28 days post lesion (dpl). (D) OCT cross sections of one individual fish prior to lesion and at 3, 7, 10, 14, and 28 dpl. Both methods showed the loss of photoreceptors at 3 dpl, their subsequent reappearance at 7 and 10 dpl as well as their proper differentiation at 14 and 28 dpl. (E) OCT fundus projections revealed the loss of the cone mosaic at 3 dpl and its subsequent recovery, although the mosaic appeared irregular even at 28 dpl. Scales represent 25 µm. |