
- Title
-
Visual Function is Gradually Restored During Retina Regeneration in Adult Zebrafish
- Authors
- Hammer, J., Röppenack, P., Yousuf, S., Schnabel, C., Weber, A., Zöller, D., Koch, E., Hans, S., Brand, M.
- Source
- Full text @ Front Cell Dev Biol
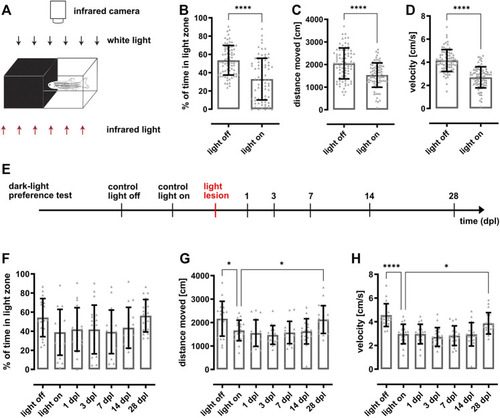
Dark-light preference behavior is statistically significant but highly variable impeding assessment of vision loss and recovery after light lesion. (A) Scheme of the dark-light preference setup. The individual compartments of the custom-made arena consist of infrared-transparent material. One half is made from clear, the other half made from black plastic establishing a light and dark zone, respectively. The test fish can freely swim within the whole compartment, which can be illuminated with white light from the top (85 lux). In addition, the arena is illuminated from an infrared light source located beneath the arena and recorded from the top using an infrared-sensitive camera. (B) Quantification reveals that the time fish spent in the light zone is significantly higher in the light off condition (53.6 ± 16.1%) compared to the light on condition (32.9 ± 22.7%). Quantifications of the distance moved (C) and the corresponding velocity (D) show that the fish swam significantly less (light off: 2060 ± 683 cm; light on: 1537 ± 543 cm) and slower (light off: 4.2 ± 0.9 cm/s; light on: 2.7 ± 0.9 cm/s) in illuminated condition. (E) Experimental timeline. Dark-light preference recordings were performed in light on and light off conditions prior to light lesion as well as in light on conditions at 1, 3, 7, 14, and 28 days post lesion (dpl). (F) Quantification of the time spent in the light zone reveals that fish do not change their preference for the dark or light zone after light lesion (light off: 54.3 ± 19.5%, light on: 38.9 ± 23.4%, 1 dpl: 41.9 ± 22.1%, 3 dpl: 41.8 ± 24.9%, 7 dpl: 39.3 ± 22.2%, 14 dpl: 43.6 ± 20.9%, 28 dpl: 56.3 ± 16.6%). Similarly, quantifications of the distance moved (G) and velocity (H) show no lesion-dependent alterations. Statistics: all data are represented as mean ± SD, unpaired t-test (B–D), one-way ANOVA with Dunnett’s multiple comparison test against control (F–H), p < 0.05 (*); 0.01 (**); 0.001 (***) or 0.0001 (****). |
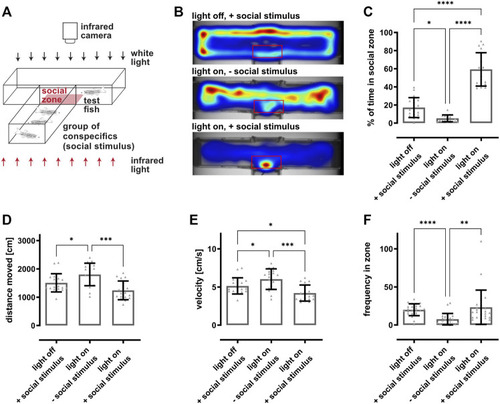
Social preference behavior is dependent on vision. (A) Scheme of the social preference setup. A custom-made T-shaped arena is divided into two completely separated compartments. The lower arm harbors a group of eight fish representing the social stimulus, whereas a single test fish is placed into the upper, perpendicular arm. A transparent window is the only non-opaque interface between the two compartments. The movement of the test fish within the compartment is recorded from the top using an infrared-sensitive camera and an infrared light source placed beneath. The zone in front of the window is defined as social zone (red box) and used for quantifications. (B) Representative heat maps indicate the test fish’s position in the compartment as a function of the condition. In dark conditions and in presence of a social stimulus (light off, + social stimulus), fish stayed in close proximity to the borders of the compartment. In illuminated conditions and absence of a social stimulus (light on, − social stimulus), fish were freely roaming within the whole compartment. In contrast, in illuminated conditions and presence of a social stimulus (light on, + social stimulus), fish spent a significant amount of time within the social zone. (C) Quantification of the time spent in the social zone revealed that fish spent significantly less time in the social zone in dark conditions (17.1 ± 10.6%) or in illuminated conditions in the absence of a social stimulus (5.3 ± 3.7%) as compared to light on conditions with a social stimulus (59.3 ± 17.9%). (D) Quantification of the distance moved showed that fish swam slightly more in illuminated conditions in the absence of a social stimulus (1804 ± 387 cm) in comparison to dark conditions (1507 ± 313 cm) or illuminated conditions with a social stimulus present (1243 ± 321 cm). (E) Quantification of the velocity revealed that the test fish swam faster in illuminated conditions in the absence of a social stimulus (6 ± 1.3 cm/s) compared to dark conditions (5.1 ± 1 cm/s) or in illuminated conditions in the presence of a social stimulus (4.2 ± 1 cm/s). (F) Quantification of the frequency of the fish entering the social zone showed that the test fish entered the social zone significantly more often in dark conditions (20 ± 8) or in illuminated conditions with a social stimulus present (24 ± 24) compared to illuminated conditions without social stimulus (8 ± 7). Statistics: all data are represented as mean ± SD, one-way ANOVA with Tukey’s multiple comparison test, p < 0.05 (*); 0.01 (**); 0.001 (***) or 0.0001 (****). |

The social preference test reveals recovery of vision within 7 days after light lesion. (A) Experimental timeline. Recordings were performed in light on conditions in presence of a social stimulus before light lesion (control) and at 1, 3, 7, 14, and 28 days post lesion (dpl). (B) Heat maps of one representative individual fish show that the time spent in the social zone decreases significantly following light lesion and returned to baseline from 7 dpl onwards. (C) Quantification of the time spent in the social zone confirms a significant decrease at 1 and 3 dpl (4.6 ± 2% and 10.8 ± 8.8%) and the return to control levels (34.5 ± 8.4%) after 7 dpl (7 dpl: 23.8 ± 14%, 14 dpl: 34.8 ± 8.7%, 28 dpl: 34.1 ± 4.7%). Quantifications of the distance moved (D), velocity (E) and frequency in zone (F) did not reveal any significant changes within the observed timeframe. Statistics: all data are represented as mean ± SD, one-way ANOVA with Dunnett’s multiple comparison test against control, p < 0.05 (*); 0.01 (**); 0.001 (***) or 0.0001 (****). |
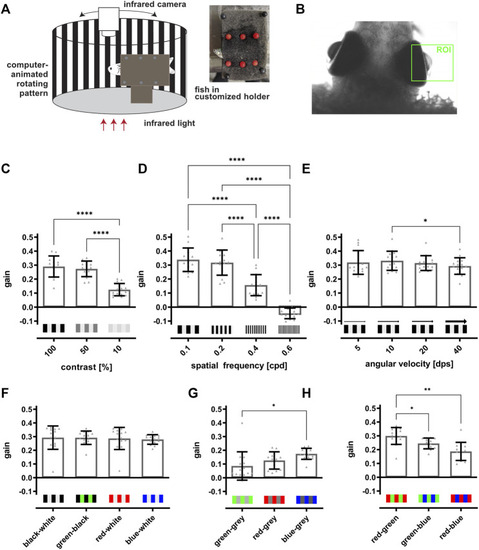
The optokinetic response of adult zebrafish is dependent on contrast, spatial frequency and color of the stimulus. (A) Scheme of the optokinetic response (OKR) setup. Utilizing a customized holder (inset), a test fish is placed in the middle of a round arena in which a computer-animated stimulus is projected onto a white drum surrounding the fish. The movement of the eyes is recorded from the top using an infrared-sensitive camera and an infrared light source placed beneath the fish. (B) Representative image of a fish placed in the OKR setup. The region of interest (ROI) for tracking the movements of the right eye is indicated in green. (C) Quantification of the gain obtained with 100, 50, and 10% contrast showed that the values for 100 and 50% contrast (0.29 ± 0.07 and 0.27 ± 0.05) are highly similar and are significantly increased in comparison to the value for 10% contrast (0.12 ± 0.04). (D) Quantification of the gain dependent on the spatial frequency revealed a significant drop from 0.1 (0.34 ± 0.08) over 0.2 (0.32 ± 0.09) and 0.4 (0.16 ± 0.07) to 0.6 cpd (−0.04 ± 0.04). (E) Quantification of the gain in dependence on angular velocity indicated no changes of the gain when the angular velocity was increased (5 dps: 0.32 ± 0.09, 10 dps: 0.33 ± 0.07, 20 dps: 0.31 ± 0.05, 40 dps: 0.29 ± 0.06). (F) Quantification showed that the gain is similar when black-white (0.29 ± 0.08), green-black (0.29 ± 0.05), red-white (0.29 ± 0.08) or blue-white stripes (0.28 ± 0.03) were used. (G) Matching the brightness of each grey level to the brightness of the respective color resulted in an overall lower gain compared to colored stripes on a black or white background. Blue-grey stripes elicited a significantly higher gain as compared to green-grey stripes (green-grey: 0.09 ± 0.01, red-grey: 0.13 ± 0.06, blue-grey: 0.17 ± 0.04). (H) Quantification revealed that two colored stimuli result in highest gains for red-green (0.3 ± 0.04), followed by green-blue (0.24 ± 0.04) and red-blue (0.19 ± 0.06). Statistics: all data are represented as mean ± SD, one-way ANOVA with Tukey’s multiple comparison test, p < 0.05 (*); 0.01 (**); 0.001 (***) or 0.0001 (****). |

The restoration of the full optokinetic response is accomplished between 10 and 14 days after light lesion dependent on the degree of difficulty. (A) Experimental timeline. The optokinetic response (OKR)-based vision test was performed before the light lesion (control) and at 3, 7, 10, 14, and 28 days post lesion (dpl). (B–J) Quantifications of the gain obtained for a black-white stimulus at a constant angular velocity of 15 dps but different combinations of contrast and spatial frequency revealed that the gain dropped significantly at 3 dpl and remains strikingly reduced at 7 dpl at all conditions. For easy conditions with high contrast and low spatial frequency (one red star), pre-lesion levels are reached at 10 dpl, whereas the OKR for medium difficulty (two red stars) returned to pre-lesion levels from 14 dpl onwards. Under hard conditions (three red stars) with low contrast and high spatial frequency, the gain was already very low at control recordings but statistically recovered by 10 dpl. All individual data points are summarized in Table 1. (K) Comparison of the relative tracking efficiency of all degrees of difficulty showed a significantly higher relative tracking efficiency at 7 and 10 dpl under easy conditions compared to medium and hard conditions. Statistics: all data are represented as mean ± SD, one-way ANOVA with Dunnett’s multiple comparison test against control (B–J), two-way ANOVA with Tukey’s multiple comparison test (K), p < 0.05 (*); 0.01 (**); 0.001 (***) or 0.0001 (****). |
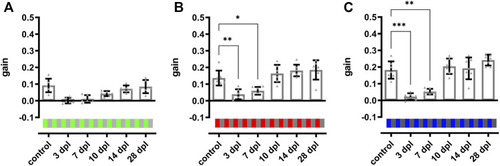
Color vision is restored at 10 days after light lesion. Quantifications of the gain obtained after light lesion for red (B) and blue (C) colored stimuli on an intensity-matched grey background (100%/0.2 cpd/15 dps) revealed a significant reduction at 3 and 7 dpl but restoration to baseline levels at 10 dpl. The quantification of the gain for a green stimulus (A) showed a similar trend but was not significantly different. Individual data are summarized in Table 2. Statistics: all data are represented as mean ± SD, one-way ANOVA with Dunnett’s multiple comparison test against control, p < 0.05 (*); 0.01 (**); 0.001 (***) or 0.0001 (****). |
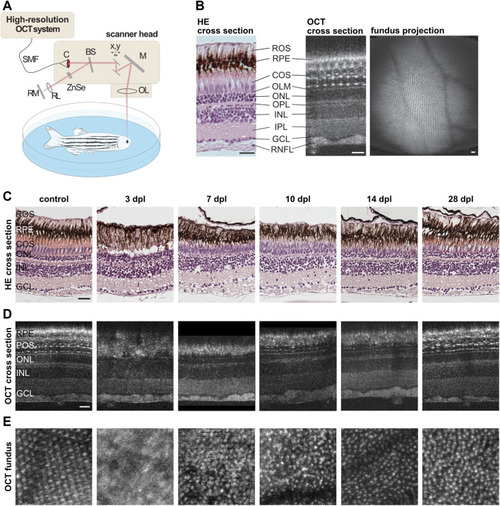
Retinal morphology is restored gradually after light lesion. (A) Scheme of the custom-built high resolution optical coherence tomography (OCT) setup. Laser light is guided to the scanner head via a single-mode fiber (SMF) and transferred into a free beam by a collimator (C). The incoming light is separated into a reference beam and a sample beam by a beamsplitter (BS). The sample light is deflected by two galvanometer scanners (x,y) to achieve a 2D scan pattern over the sample, reflected by a mirror (M) and focused by an adjustable focus lens (OL) into the eye where it is scattered and reflected back. The reference beam is guided through a zinc selenide glass (ZnSe) and focused by a lens (RL) before being reflected by a mirror (RM). Both beams are superimposed by the beamsplitter, spectrally resolved measured by a line scan sensor. (B) Comparison of a retinal cross section stained with hematoxylin/eosin (HE) and a cross section obtained via OCT imaging revealed a high degree of similarity. With the exception of the rod outer segments (ROS) which can be recognized only in HE stained samples at the top, all subsequent layers including the retinal pigment epithelium (RPE), the cone outer segments (COS), the outer limiting membrane (OLM), the outer nuclear layer (ONL), the outer plexiform layer (OPL), the inner nuclear layer (INL), the inner plexiform layer (IPL), the ganglion cell layer (GCL) and the retinal nerve fiber layer (RNFL) can be seen in both, HE and OCT. In addition, small hyper-reflective structures were observed in the photoreceptor layer imaged with OCT that mark the intersection between cone inner and outer segments. A fundus projection calculated from the OCT data showed the cone mosaic pattern as well as the retinal blood vessels in the central part of the retina. (C) HE stainings of unlesioned control samples as well as specimen fixed at 3, 7, 10, 14, and 28 days post lesion (dpl). (D) OCT cross sections of one individual fish prior to lesion and at 3, 7, 10, 14, and 28 dpl. Both methods showed the loss of photoreceptors at 3 dpl, their subsequent reappearance at 7 and 10 dpl as well as their proper differentiation at 14 and 28 dpl. (E) OCT fundus projections revealed the loss of the cone mosaic at 3 dpl and its subsequent recovery, although the mosaic appeared irregular even at 28 dpl. Scales represent 25 µm. |