
FIGURE 4
- ID
- ZDB-FIG-220220-26
- Publication
- Hammer et al., 2022 - Visual Function is Gradually Restored During Retina Regeneration in Adult Zebrafish
- Other Figures
- All Figure Page
- Back to All Figure Page
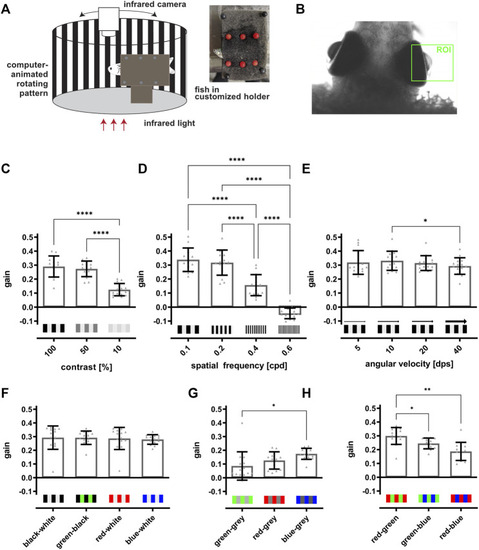
The optokinetic response of adult zebrafish is dependent on contrast, spatial frequency and color of the stimulus. (A) Scheme of the optokinetic response (OKR) setup. Utilizing a customized holder (inset), a test fish is placed in the middle of a round arena in which a computer-animated stimulus is projected onto a white drum surrounding the fish. The movement of the eyes is recorded from the top using an infrared-sensitive camera and an infrared light source placed beneath the fish. (B) Representative image of a fish placed in the OKR setup. The region of interest (ROI) for tracking the movements of the right eye is indicated in green. (C) Quantification of the gain obtained with 100, 50, and 10% contrast showed that the values for 100 and 50% contrast (0.29 ± 0.07 and 0.27 ± 0.05) are highly similar and are significantly increased in comparison to the value for 10% contrast (0.12 ± 0.04). (D) Quantification of the gain dependent on the spatial frequency revealed a significant drop from 0.1 (0.34 ± 0.08) over 0.2 (0.32 ± 0.09) and 0.4 (0.16 ± 0.07) to 0.6 cpd (−0.04 ± 0.04). (E) Quantification of the gain in dependence on angular velocity indicated no changes of the gain when the angular velocity was increased (5 dps: 0.32 ± 0.09, 10 dps: 0.33 ± 0.07, 20 dps: 0.31 ± 0.05, 40 dps: 0.29 ± 0.06). (F) Quantification showed that the gain is similar when black-white (0.29 ± 0.08), green-black (0.29 ± 0.05), red-white (0.29 ± 0.08) or blue-white stripes (0.28 ± 0.03) were used. (G) Matching the brightness of each grey level to the brightness of the respective color resulted in an overall lower gain compared to colored stripes on a black or white background. Blue-grey stripes elicited a significantly higher gain as compared to green-grey stripes (green-grey: 0.09 ± 0.01, red-grey: 0.13 ± 0.06, blue-grey: 0.17 ± 0.04). (H) Quantification revealed that two colored stimuli result in highest gains for red-green (0.3 ± 0.04), followed by green-blue (0.24 ± 0.04) and red-blue (0.19 ± 0.06). Statistics: all data are represented as mean ± SD, one-way ANOVA with Tukey’s multiple comparison test, p < 0.05 (*); 0.01 (**); 0.001 (***) or 0.0001 (****). |