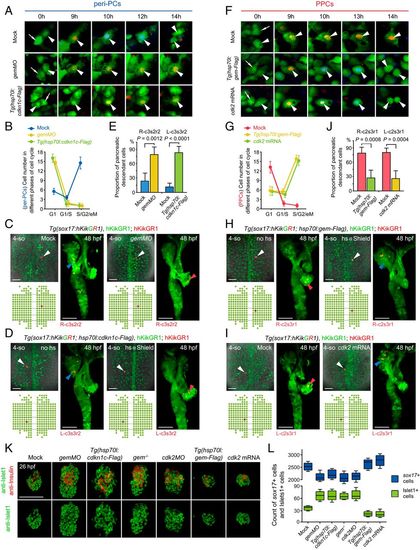
Manipulations of the cell cycle state modulate demarcation of pancreatic progenitors. (A–E) Extensive prolongation of the G1 phase of peri-PCs significantly increased their pancreatic fate propensity and enlarged pancreatic progenitor populations. Application of gemMO or heat shock–inducible overexpression of cdkn1c efficiently prolonged the G1 phase of peri-PCs as shown by single-cell live images (A, arrowheads), which was validated by the increased number of sox17+ cells in the G1 phase and reduced number of sox17+ cells in the S/G2/eM phases (B, n = 5). Consequently, examples of single-cell labeling and descendant tracing of peri-PCs showed increased descendant distributions to the pancreatic bud and gain of pancreatic progenitor identity (C and D), which were confirmed by the statistics (E, n = 5). (F–J) Shortening the G1 phase of PPCs significantly reduced their pancreatic fate propensity and pancreatic progenitor populations. Heat shock–inducible overexpression of geminin or general overexpression of cdk2 shortened the G1 phase of PPCs (F), which was validated by the reduced number of sox17+ cells in the G1 phase and increased number of sox17+ cells in the S/G2/eM phases (G, n = 5). As a result, examples of single-cell labeling and descendant tracing of PPCs showed decreased descendant distributions to the pancreatic bud and loss of pancreatic progenitor identity (H and I), which were confirmed by the statistics (J, n = 5). (K and L) After manipulations of the cell cycle state, antibody staining showed an increased and decreased number of Islet1+ and Insulin+ cells at 26 hpf (K), which were validated by statistics (L, n = 10). The corresponding alterations of the sox17+ cell number were counted by fluorescence activating cell sorter (FACS) and statistically analyzed (L, n = 5). (Scale bar, 50 μm.) 4-so, 4-somite stage; gem, geminin; hs, heat shock. Data are expressed as mean ± SD; P value is calculated using Student’s t test.
|
