|
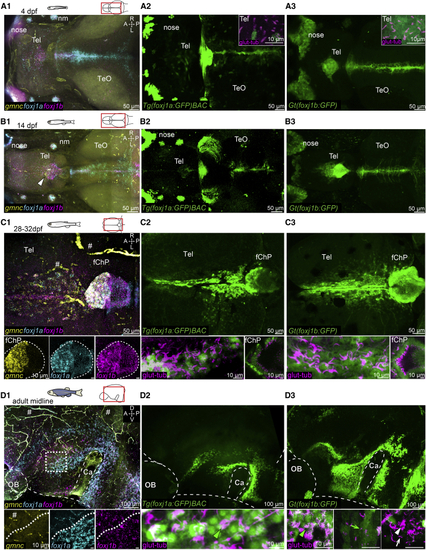
Ciliated cells in the TC, telencephalon, and ChP express foxj1a, foxj1b, and gmnc to different extents (A–D) Expression of foxj1a, foxj1b, and gmnc in the brain using multiplex HCR (A1–D1) and two transgenic lines, Tg(foxj1a:gfp)BACvcc41 (A2–D2) and Gt(foxj1b:GFP)tsu10Gt (A3–D3). (A1–A3) At 4 dpf, foxj1b is expressed in the dorsal telencephalon, nose, neuromasts, and midbrain; foxj1a is expressed in the nose, neuromasts, and midbrain; and no gmnc HCR signal is detected in the brain. Cells with a solitary glutamylated tubulin-labeled cilium (magenta in A2 and A3 insets) on the dorsal telencephalon express primarily foxj1b. (B1–B3) At 14 dpf, there is an expansion of foxj1b-expressing cells anterior to the ChP (B1 and B3). foxj1a expression remains low in the dorsal telencephalon and ChP (B1 and B2). Few gmnc puncta are present in the anterior part of the ChP (arrowhead in B1). (C1–C3) At 1 month, gmnc and foxj1a are highly expressed in the anterior ChP and dorso-medial TC (C1 and C2). (C1 and C3) foxj1b is expressed in both the anterior and posterior ChP. (C2 and C3) foxj1a:GFP and foxj1b:GFP cells bear glutamylated tubulin-positive cilia. (D1–D3) On the midline of the adult telencephalon/diencephalon, foxj1a and foxj1b are mainly expressed in the ventral part of the brain, surrounding the Ca. (D1) foxj1a- and foxj1b-expressing domains are not fully overlapping. The dotted line in inset indicates a sharp boundary for foxj1a expression but not for foxj1b. There is very low gmnc expression. (D2 and D3) Immunostaining with glutamylated tubulin shows that foxj1a:GFP- and foxj1b:GFP- expressing cells harbor multiple cilia (arrowhead) or a solitary cilium (arrow). (D3) Ciliated cells with multiple cilia (white arrowhead) or a single cilium (white arrow) are foxj1b:GFP-negative. Number of datasets: A1 = 4, B1 = 4, C1 = 4, D1 = 3, A2 = 4, B2 = 3, C3 = 4, D3 = 4, A3 = 4, B3 = 3, C3 = 4, and D3 = 3. A, anterior; P, posterior; D, dorsal; V, ventral; M, medial; L, lateral; Tel, telencephalon; TeO, optic tectum; OB, olfactory bulb; nm, neuromast. Note that there is unspecific HCR signal associated with blood cells and vasculature (indicated by the hashtag symbol). See also Figure S2.
|