FIGURE

Figure 6

ID
ZDB-FIG-211029-103
Publication
D'Gama et al., 2021 - Diversity and function of motile ciliated cell types within ependymal lineages of the zebrafish brain
Other Figures
All Figure Page
Back to All Figure Page
Figure 6

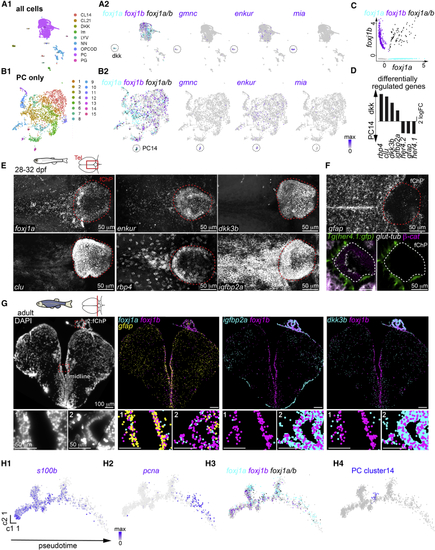
Diversity of motile ciliated cells in the forebrain

(A and B) Single-cell RNA sequencing analysis of all cells (A1) or all progenitor-like cells (PCs; B1) revealed the presence of two potential ependymal clusters, dkk (A2) and PC14 (B2), based on the expression of foxj1a/b (foxj1a-only cells in cyan, foxj1b-only cells in magenta, and foxj1a/b-co-expressing cells in black) gmnc, enkur, and mia.

(C) Scatterplot representing the expression levels of foxj1a and foxj1b in all cells.

(D) Selection of differentially regulated genes between the dkk and PC14 ependymal clusters.

(E) The dkk cluster markers dkk3b (n = 5), clu (n = 13), rbp4 (n = 4), and igfbp2a (n = 8) are expressed in the 1-month-old TC and ChP, similar to foxj1a and enkur, as shown by HCR.

(F) The PC14 markers gfap (n = 4) and her4 (n = 3) are excluded from the ChP at 1 month. (Top) HCR for gfap shows expression in radial glia and absence of signal in ChP. (Bottom) Immunostaining of Tg(her4:gfp) with membrane marker β-catenin and cilia marker glutamylated tubulin revealed the absence of her4:gfp signal in ciliated cells of the ChP.

(G) Molecular cartography on an adult telencephalic cryosection (DAPI; left) showed that foxj1a and foxj1b colocalized with gfap in the midline (inset 1) and not in the ChP (inset 2) and that igfbp2a and dkk3b are enriched in the ChP (inset 2) as compared to the midline (inset 1). n = 7 sections from one brain.

(H1–H4) Pseudotime analysis of the PCs plotted using Monocle algorithm showed a progression from quiescent (s100b; H1) to a proliferative stage (pcna; H2). (H3) foxj1b is expressed more in quiescent progenitors, while foxj1a is expressed more in proliferative progenitors. (H4) PC14 ependymal cells (indicated in blue) branch out from quiescent progenitors.

See also Figure S6 and Table S1.

Expression Data
Genes:
Fish:
Anatomical Terms:
Stage Range: Days 21-29 to Adult

Expression Detail
Antibody Labeling
Phenotype Data

Phenotype Detail
Acknowledgments
This image is the copyrighted work of the attributed author or publisher, and ZFIN has permission only to display this image to its users. Additional permissions should be obtained from the applicable author or publisher of the image. Full text @ Cell Rep.