
Fig. 1
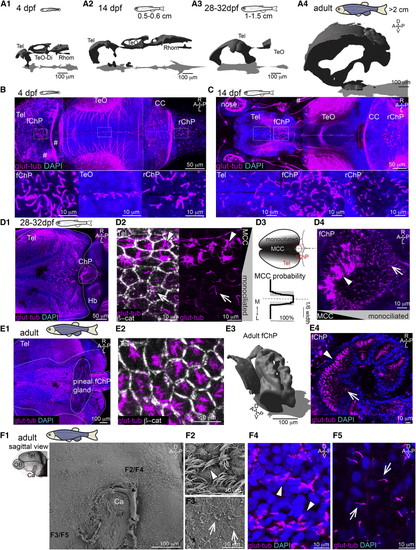
Multiciliation and ventricular/parenchymal expansion correlate during development (A1–A4) Brain ventricles expand during development as shown upon 3D reconstruction of brain ventricles injected with Rhodamine B isothiocyanate (RITC)-dextran. (A1) 4 dpf, n = 4; (A2) 14 dpf, length: 0.5 to 0.6 cm, n = 4; (A3) 28 to 32 dpf, length: 1–1.5 cm, n = 3; and (A4) 2 to 12 months, larger than 2 cm, n = 3. (B) At 4 dpf, single glutamylated tubulin-positive cilia are located on the forebrain choroid plexus (fChP), on the dorsal roof and ventral part of the tectal/diencephalic ventricle, and in the rhombencephalic ChP (rChP) (n = 5). Dashed lines label boundaries between confocal tiles. (C) At 14 dpf, cilia number increases along the dorsal telencephalon, rostral to the fChP, and in the rChP. Cells are monociliated throughout the brain (n = 3). (D1–D4) At 28 to 32 dpf, brushes of glutamylated tubulin-positive cilia appear on the dorsal telencephalon anterior to the ChP and in the ChP (n = 3; D1). (D2) The presence of monociliated (arrow) and MCCs (arrowhead) is shown upon co-staining with the membrane marker β-catenin. (D3) MCCs are located medially to monociliated cells in the tela choroida (TC; quantified in bottom panel; n = 9). (D4) The fChP comprises mono- and MCCs, arranged in an anterior-posterior manner (n = 3). (E1–E4) In the adult brain, MCCs are enriched in the medial part of the TC above the telencephalon (E1) and in the ChP (E4). (E2) Cilia do not cover the entire apical surface of MCCs as shown upon co-staining with β-catenin (n = 4). (E3) Adult fChP consists of multiple interconnected cavities, as shown upon 3D reconstruction of ventricles injected with RITC-dextran (n = 4), and contains mono- and MCCs (E4) (n = 3). (F1–F5) Mono- and MCCs are present on the adult telencephalic/diencephalic midline in the region surrounding the anterior commissure (Ca) highlighted in red. Scanning electron microscopy (n = 3) and immunostaining with glutamylated tubulin (n = 3) show the presence of MCCs (F2 and F4) and monociliated cells (F3 and F5). Location of (F2)–(F5) is indicated in (F1). A, anterior; P, posterior; D, dorsal; V, ventral; M, medial; L, lateral; Tel, telencephalon; TeO, optic tectum; Rhomb, rhombencephalon; CC, cerebellum; MCCs, multiciliated cells. Arrowheads show MCCs, and arrows show monociliated cells. See also |