
Fig. 7
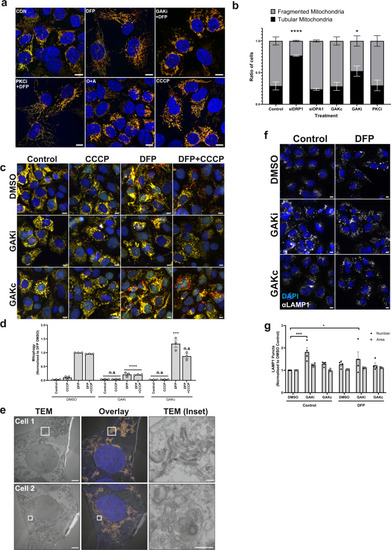
a Representative ×63 images of U2OS IMLS cells taken by Zeiss LSM710 confocal microscopy. Cells were treated ± 1 mM DFP 24 h in addition to GAKi (10 µM), sotrastaurin (PKCi—2 µM), oligomycin and antimycin A (O + A—10 µM and 1 µM, respectively) or CCCP (20 µM), scale bar = 10 µm. b Machine-learning classification of U2OS IMLS cell mitochondrial network as fragmented or tubular (utilising EGFP images, see methods) ± SEM from n = 3 independent experiments after 24 h treatment with GAKi (10 µM), GAKc (10 µM) or sotrastaurin (PKCi—2 µM) compared to 72 h knockdown of non-targeting control, siDRP1 or siOPA1. Significance was determined by two-way ANOVA followed by Dunnett’s post-test to the control treatment. c U2OS IMLS cells were treated as indicated with DMSO, GAKi or GAKc (10 µM each) for 24 h in addition to either DFP (24 h, 1 mM), CCCP (20 µM, 12 h) or in combination. Images obtained by ×20 objective, scale bar = 10 µm. d Quantitation of mean mitophagy per cell from cells treated as in (c) ± SEM from n = 3 independent experiments. Significance was determined by two-way ANOVA followed by Dunnett’s post-test to the equivalent DMSO treatment. e U2OS IMLS cells were treated with 1 mM DFP + 10 µM GAKi for 24 h prior to fixation for CLEM analysis. EM images demonstrate mitochondrial clustering (Cell 1) and an increase in autolysosome structures (Cell 2) induced by GAKi treatment, scale bar = 10 µm, inset = 1 µM. f U2OS cells treated ± 1 mM DFP 24 h in addition to DMSO, GAKi (10 µM) or GAKc (10 µM) were PFA fixed and subsequently stained for endogenous LAMP1. Images acquired at ×20 by widefield microscopy on a Zeiss AxioObserver microscope, scale bar = 10 µm. g Quantitation of LAMP1 structures identified in (f) for size and number and plotted as mean ± SEM from n = 4 independent experiments. Significance was determined by two-way ANOVA followed by Dunnett’s multiple comparisons test to the DMSO control. Significance was denoted where *P < 0.05, ***P < 0.01, ****P < 0.0001 and n.s. = not significant in all relevant panels. For precise P values, see the source data file. |